
1-NZDUSD trading plan.
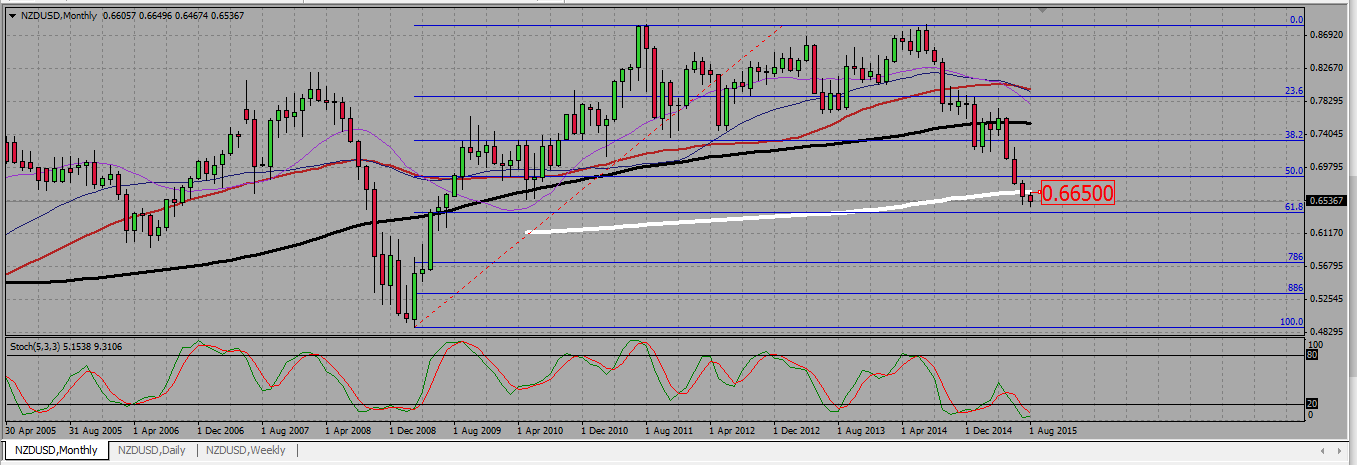
the pair is ranging between 0,65 support value and a 0,675 resistance level. The monthly 200 SMA around 0,665 is also a level to watch.
On the monthly chart the pair broke down the 200 SMA around 0,665 and is now retesting it as a resistance. Although the current monthly candle is bearish and made a new low, it is too early to say whether this retest has already failed or not; we may end the month with a morning star or a hammer.
NZDUSD MONTHLY CHART.
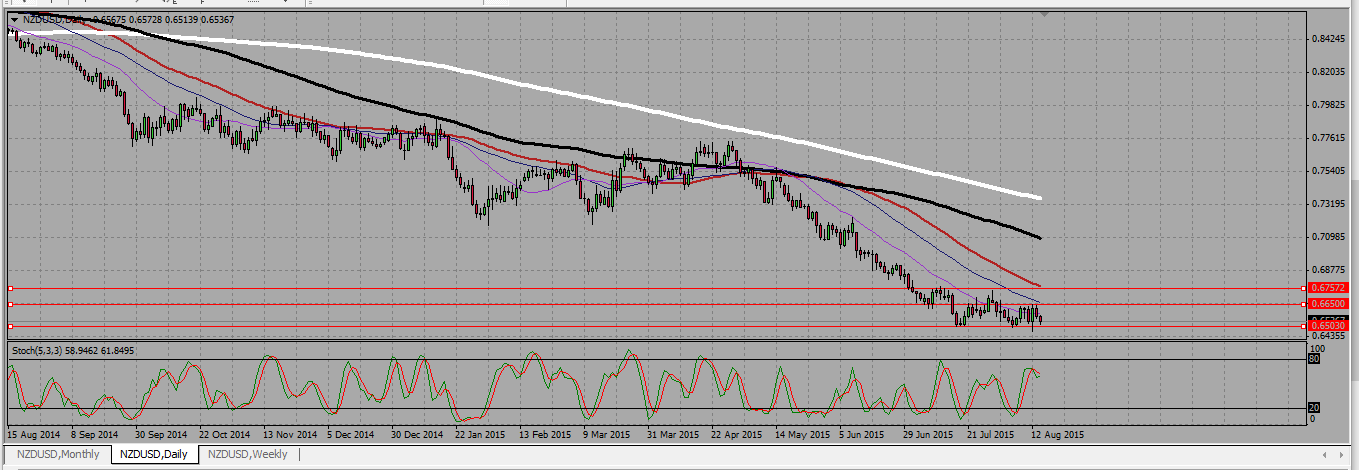
On the daily chart, we see the pair ranging between 0,65 and 0,675. I will therefore trade it accordingly (straight reversal inside the range, confirmed breakout outside the range). I will also keep in mind that 0,665 level as a potential resistance inside that range.
NZDUSD DAILY CHART.
2-EURAUD trading plan.
The pair is consolidating within a triangle. The daily looks rather bullish.
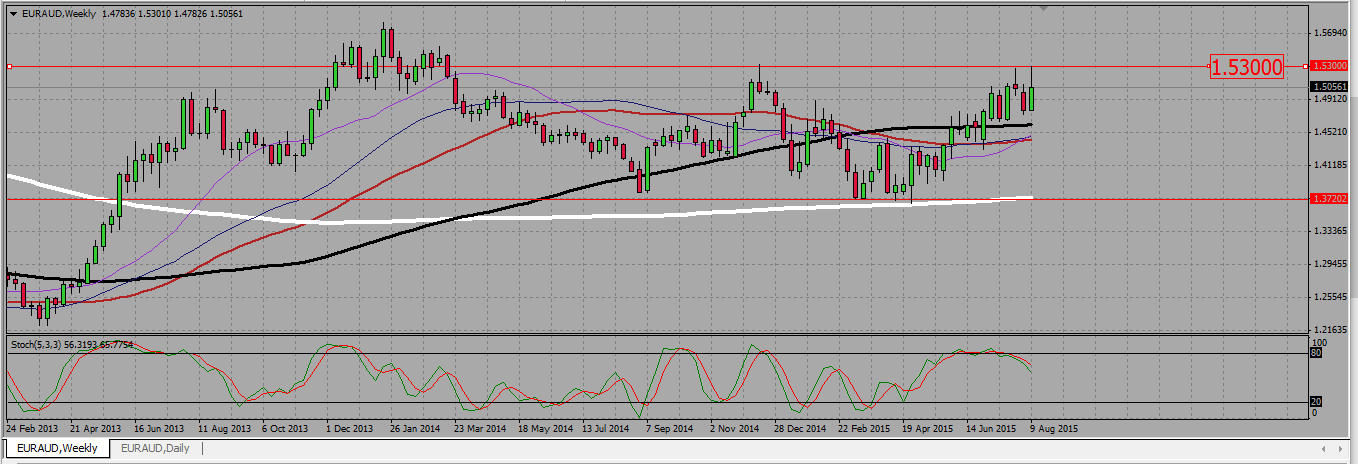
On the weekly chart we see the pair in a range between 1,37 and 1,53. It made a double top at 1,53, and the last weekly candle, although bullish, could mean a third failed attempt at that 1,53 resistance level.
EURAUD WEEKLY CHART.
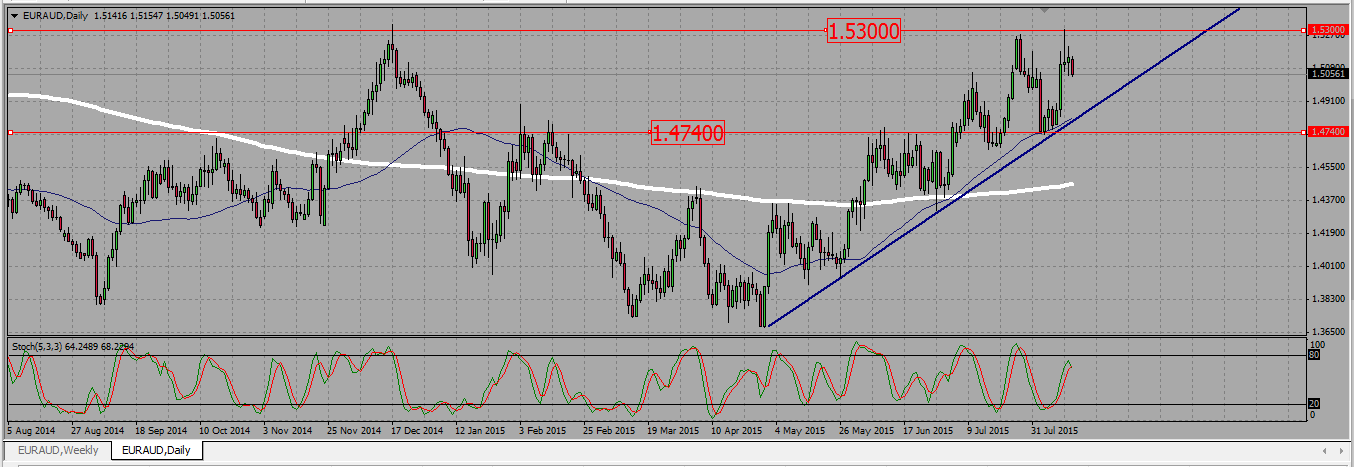
On the daily chart we clearly see that the 1,53 resistance level has been rejected on Wednesday with a daily shooting star. There is a support trend line, that roughly goes along the daily 40 SMA (deep blue line).
Although there is a clear rejection of the 1,53 level, on the daily graph and as long as we do not break down the previous low at 1,474 we are still technically in a strong uptrend. This is why I will be looking for buying signals at that level unless we get a confirmed break down of the daily 40 SMA, currently around 1,48.
EURAUD DAILY CHART.
3-AUDNZD trading plan.
The pair is in a wedge on the daily chart, but wait for a bullish break out of 1,1375 to enter long.
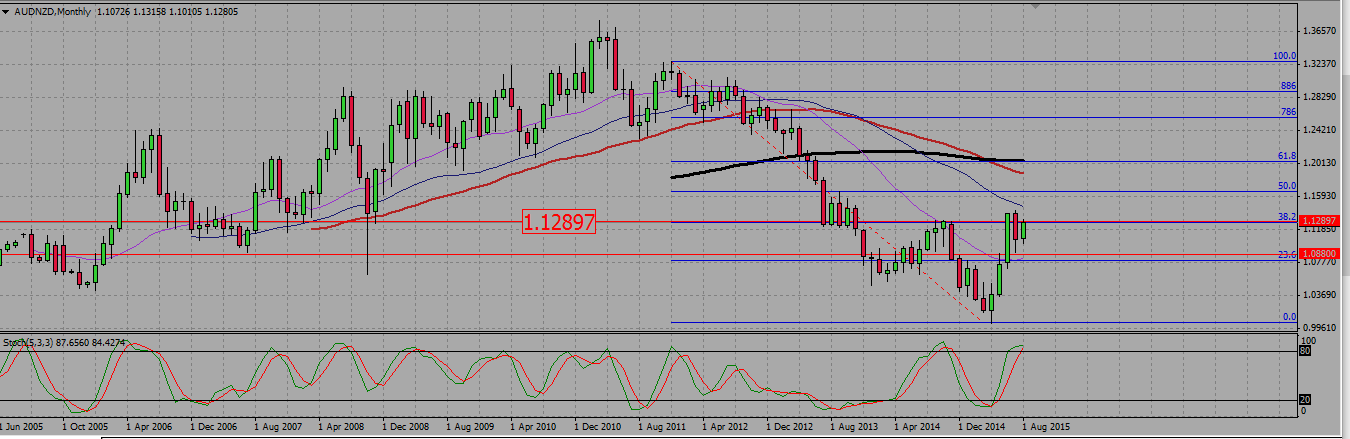
On the monthly chart, we see the pair was in a strong downtrend. Then on April May June it gave a “three white soldiers” configuration, ending in June with a breaking up of the last monthly high around 1,13. On July the pair did not however confirm that breaking up and plunged back under 1,13, to turn up once again at the beginning of this month. It is now retesting 1,13 as a resistance.
AUDNZD MONTHLY CHART.
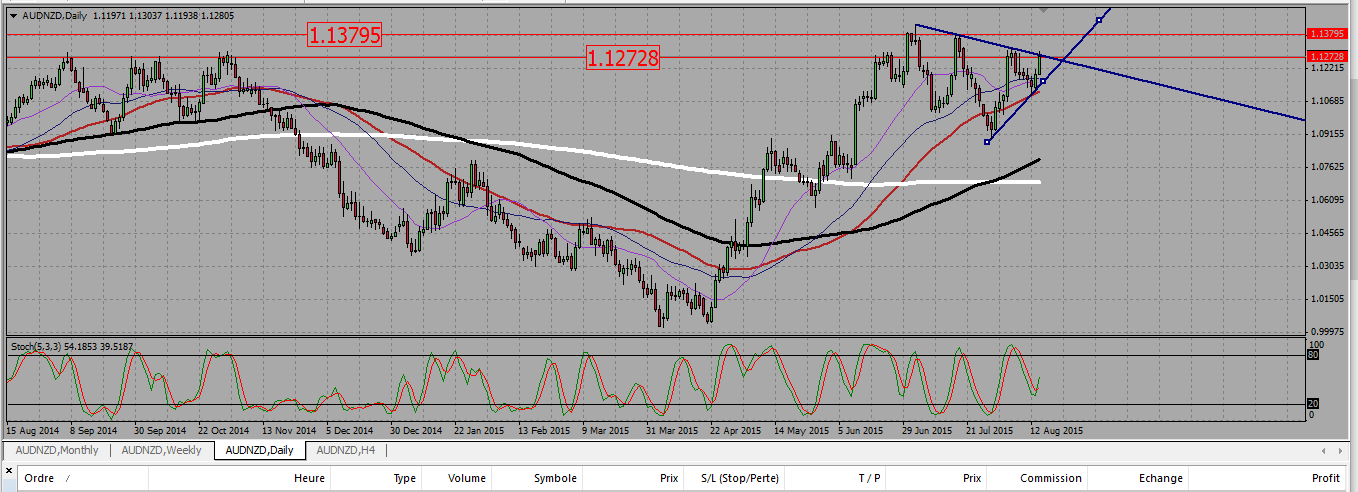
On the daily chart we see the strong upward move (the monthly three white soldiers) that pushed the pair above 1,13, up to 1,1375. Since then we are making consequently lower highs, to the point of being able to draw a resistance trend line.
Although we are making lower highs, it seems we are now making higher lows, so the pair seems to evolve within a wedge. I will trade this wedge on the bearish side, but I will avoid entering long under 1,1375 ; I prefer for that resistance to be broken to start looking to buy that pair.
AUDNZD DAILY CHART.
 (No Ratings Yet)
Add your review