
FREE: Subscribe to this Weekly Forex analysis if you like this trading plan 😉
USDCAD trading plan.
Buy dips toward 1,4025 and 1,455.
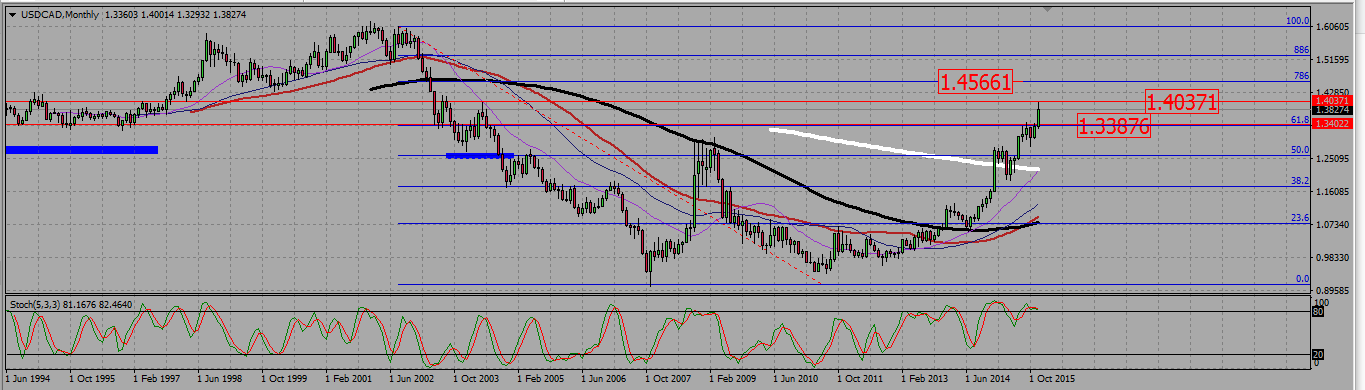
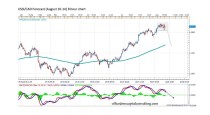
The loonie is in an uptrend. On the monthly chart all short terms SMAs are turning north, and the pair broke up a strong resistance at 1,338, which is now a support. The CAD could not however pass another, minor, resistance around 1,40 1,4025, and felt back under 1,40. Technically the pair may go back to retest the 1,3338 level, but that is unlikely. I think it will rather turns bullish again and will retest, and eventually break up that 1,4025 resistance to go as far as the 0,786 Fibonacci resistance level around 1,455, and may be even higher.
USDCAD MONTHLY CHART.
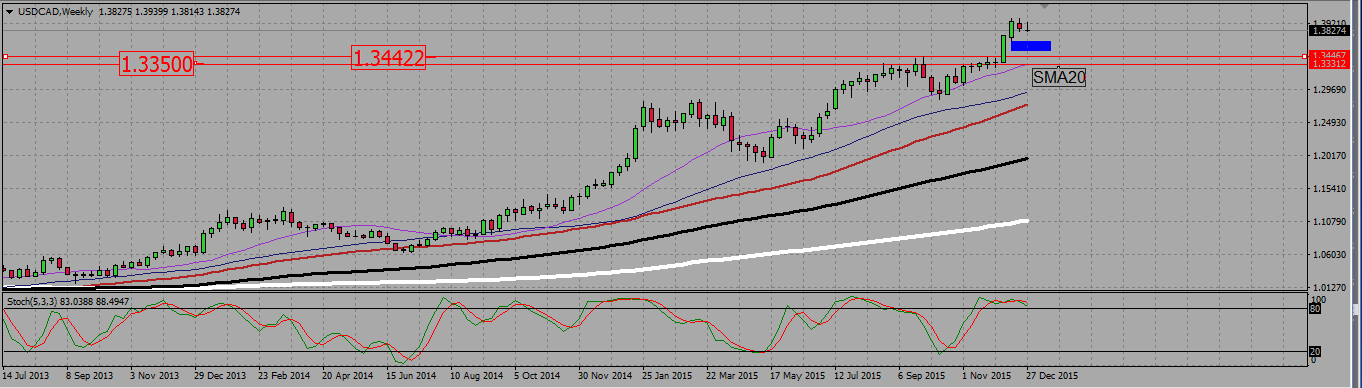
The weekly chart is a clear uptrend, but the pair shows some signs of bearishness : there is a stochastic bearish divergence, and a bearish harami followed by an indecision candle (see the blue rectangle). This means we could start the year with some bearish consolidation. In such a case, an obvious support zone is between 1,345 and 1,3335, with the weekly 20 SMA also coming into it. A retest of that support would however mean a 500 pips consolidation, and that looks unlikely. Nonetheless, I will wait for a clear bullish signal to enter into a trade.
USDCAD WEEKLY CHART.
NZDUSD trading plan.
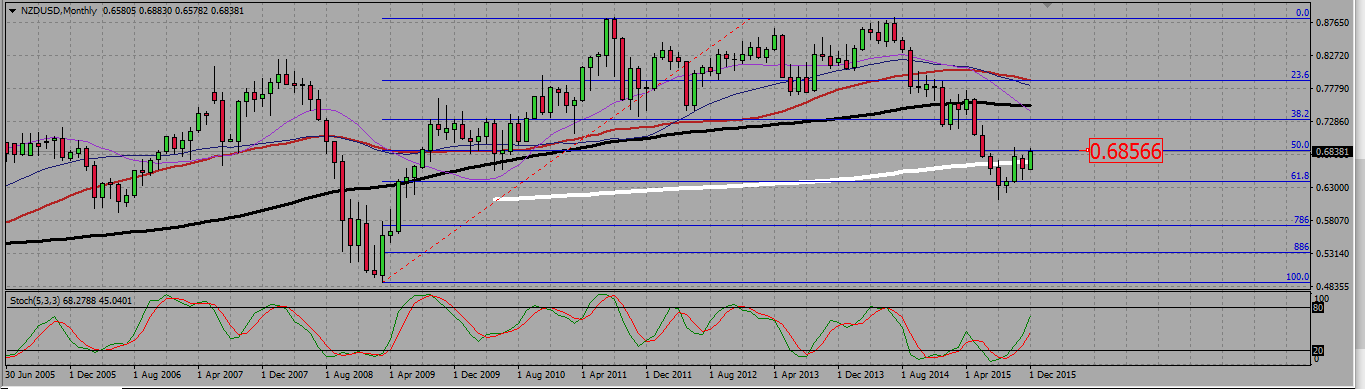
Watch current level ( 0,685 0,70) as it is a strong resistance. A bearish reversal would mean a retest of the monthly 200 SMA around 0,67 0,66, while a bullish break out would open the way to the 38,2 Fibonacci level around 0,73.
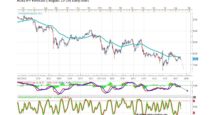
On the monthly chart, the pair is retesting a 50 Fibonacci resistance level that has been broken as a support in June 2015. It has already been tested as a resistance in October but held. With the December candle also retesting that level, we even have a potential double top here.
NZDUSD MONTHLY CHART.
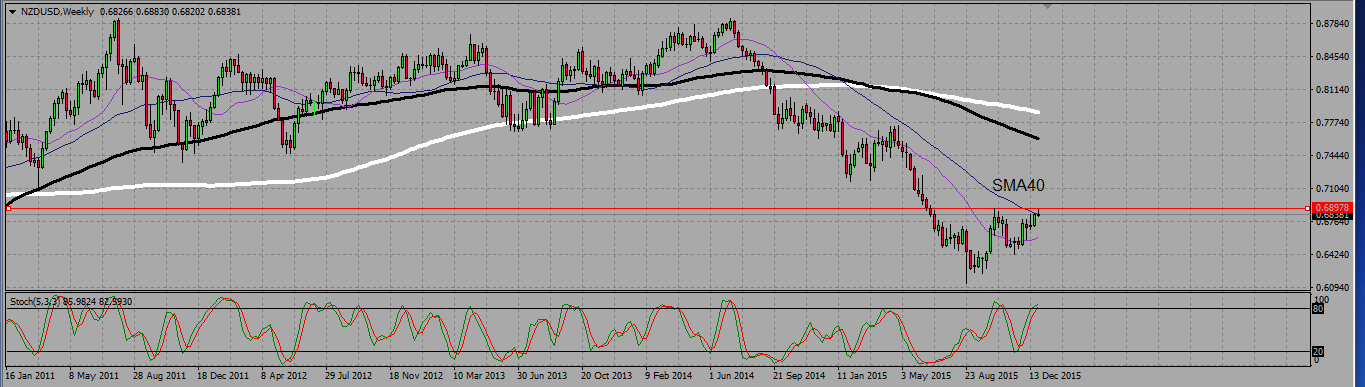
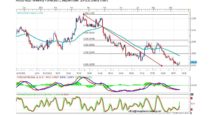
On the weekly chart the SMAs are turning down, as for a bearish trend. We see the 0,69 level as a potential double top, with upwicks on the candles at that level, meaning there is a resistance there. that resistance is made even stronger by the 40 SMA that also prevent the pair from going higher.
NZDUSD WEEKLY CHART.
 (No Ratings Yet)
Add your review