
Subscribe to Updates (Weekly forex analysis by Stephen L) via Email
USDCAD trading plan.
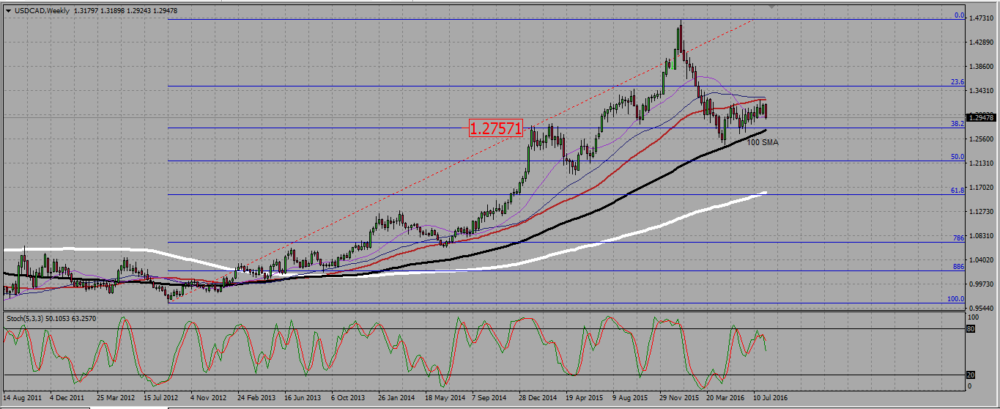
There is a clear bearish signal on the weekly chart. Watch price action at the support trend line of a daily bullish triangle; if the pair breaks it down, sell towards the weekly 100 SMA, probably between 1,275 and 1,28.
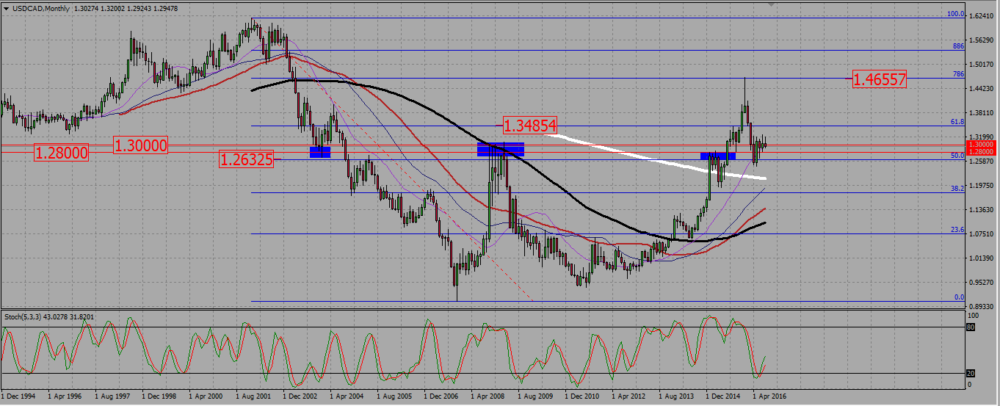
On the monthly chart, we see the beginning of some ranging action around 1,30. The loonie has been consolidating south since January this year until April, where it rejected a support near 1,26. It then climbed back above 1,30, but looked unable to go higher, and since June it is just going nowhere.
USDCAD MONTHLY CHART.
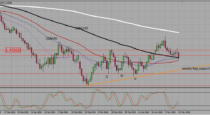
There is a very clear bearish engulfing pattern on the weekly chart. Is is a sale, and the take profit will be the 100 SMA, currently getting close to a Fib level above 1,275.
USDCAD WEEKLY CHART.
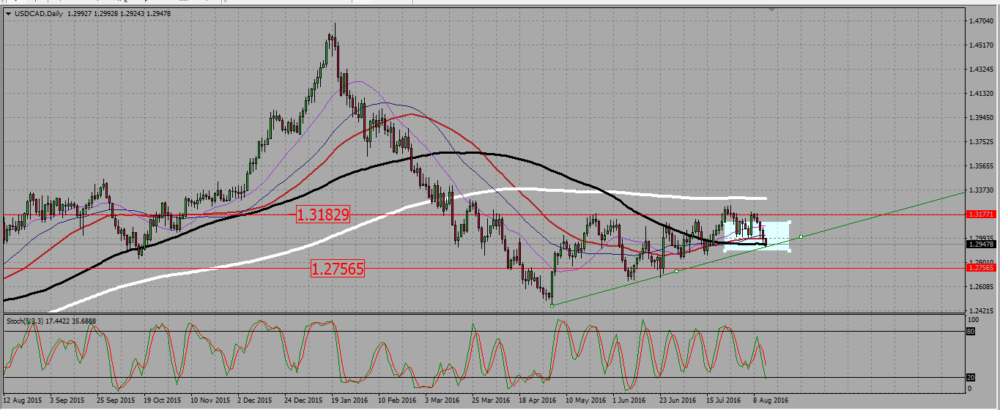
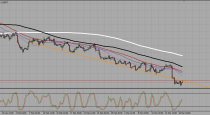
The pair is consolidating within a bullish triangle on the daily chart. It stands close to the support trend line, but more significantly made a lower low -within the rectangle on the chart-. This is the first time USDCAD shows a lower low since June this year, and this is a very strong bearish sign. I will wait for it to break down the triangle support, or to pull back a little bit before shorting that pair.
USDCAD DAILY CHART.

 (2 votes, average: 4.50 out of 5)
Add your review