
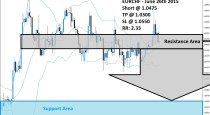
Buy and hold above 1,28. Avoid selling above 1,24, where a support zone is located.
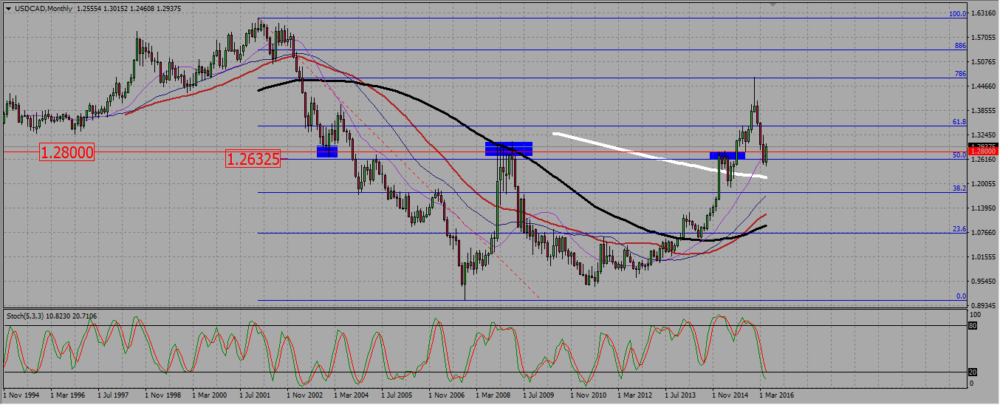
On the monthly chart, the pair seems to end a three months bearish consolidation time. It found support around 1,25, and has managed to climb by more than 400 pips. Apart from the 200 SMAs, still slightly pointing down, all other SMAs are rather indicating an uptrend.
USDCAD MONTHLY CHART.
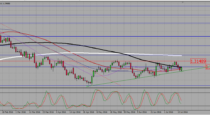
On the weekly chart we are in an uptrend. Following a strong bullish engulfing candle, the pair post a dragonfly doji, which is also a broken resistance retest around 1,28. The fact that this retest ended with a doji means it may not be over, and the loonie may still go to retest that support once more. But I will try to buy signals above it in the hope for a renewal of the bullish trend. There is also a clear bullish stochastic divergence.
USDCAD WEEKLY CHART.

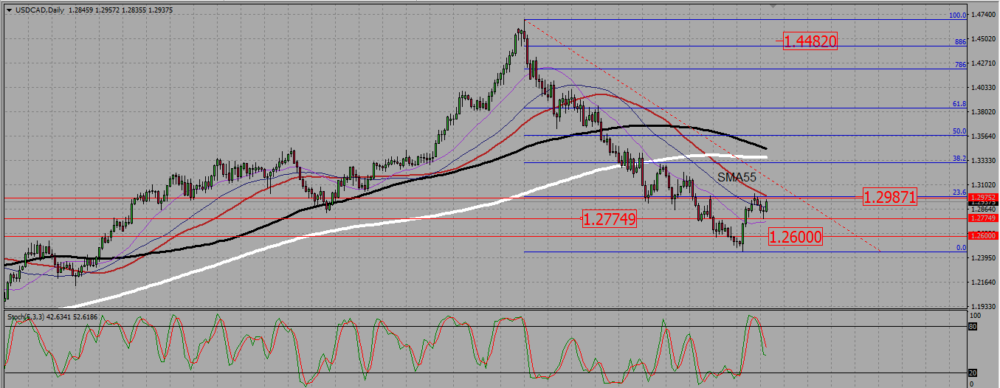
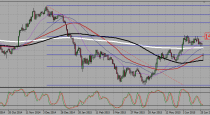
On the daily chart, we see the three month long bearish consolidation, and the reversal around 1,25. The pair is now stalling just under a resistance near 1,30 with a 23,6 Fibonacci levelallso preventing it from going higher . As the 55 SMA is now getting close to that level too, I would not be surprised to see another failure the next time the pair tries to break that level. But I think it will eventually mange to pass it.
USDCAD DAILY CHART.
 (1 votes, average: 5.00 out of 5)
Add your review