
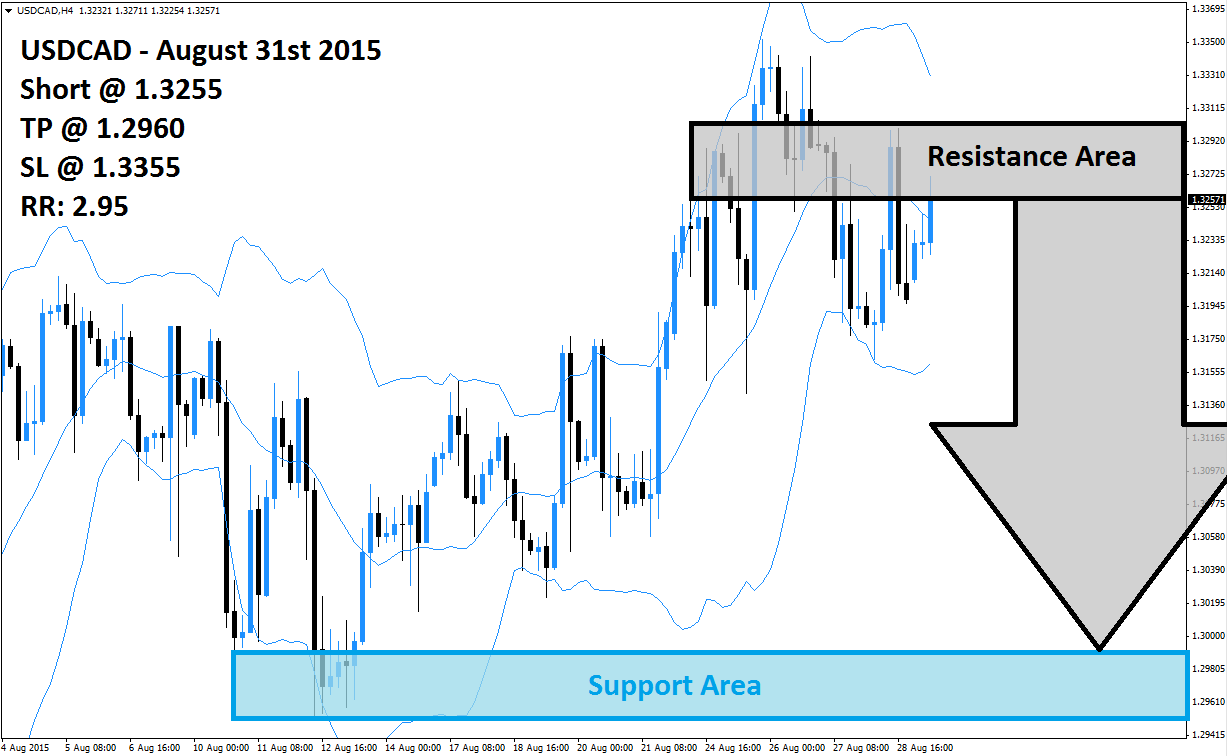
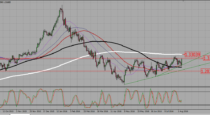
The USDCAD rallied from its support area, marked in light blue in the above H4 chart, to its resistance area which is visible in light grey. The rally was initialized by short-covering and was able to take this currency pair above of its resistance area for a short period of time from where the rally collapsed. The USDCAD did breakdown below its resistance area and another round of profit taking may follow the breakdown.
The failure to keep the rally alive past its resistance area may be taken by forex traders as a reason to realize floating trading profits and exit existing long positions. The Bollinger Band indicator shows the upper band, which is trading above is resistance area, as well as the middle band, trading below its resistance area, sloping to the downside while the lower band started to slope to the upside. The USDCAD could face a sharp sell-off once price action will break below its middle band.
Forex traders are advised to enter short positions at 1.3255 and above in order to profit from the expected profit taking sell-off in this currency pair. Conservative forex traders should wait for price action to break down below the middle band of its Bollinger Band Indicator which will increase selling pressure. A take profit target of 1.2960 has been selected for a potential trading profit of 295 pips. More sell-orders are expected below the middle band of the Bollinger Band indicator.
Forex traders should protect this trade with a stop loss level at 1.3355 for a potential trading loss of 100 pips which will result in a Risk-Reward (RR) ratio of 2.95.
USDCAD
Short @ 1.3255
TP @ 1.2960
SL @ 1.3355
RR: 2.95
 (No Ratings Yet)
Add your review