

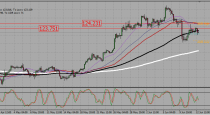
The USDCAD rallied from its support area into its resistance area, marked in light grey in the above H4 chart. The resistance was solid enough to end the rally and this currency pair entered a sideways drift below its resistance area. The Bollinger Band indicator has confirmed the sideways trend with one of its own and price action is trading between the middle band and the upper band of the Bollinger Band indicator.
Given the sideways trend, the USDCAD is likely to enter a sell-off driven by forex traders who wish to realize floating trading profits by closing existing long positions. This will result in a profit taking sell-off and can accelerate one the USDCAD trades below the middle band of the Bollinger Band. The sell-off could run until price action will reach its support area visible in light blue. Upside potential from its resistance area remains unattractive.
Forex traders are advised to enter short positions at 1.3300 and above in order to be well position for the expected profit taking sell-off in this currency pair and a break in the up-trend. Conservative forex traders should wait for price action to break down below the middle band of its Bollinger Band Indicator which will increase selling pressure. A take profit target of 1.2850 has been selected for a potential trading profit of 450 pips.
Forex traders should protect this trade with a stop loss level at 1.3500 for a potential trading loss of 200 pips which will result in a Risk-Reward (RR) ratio of 2.25.
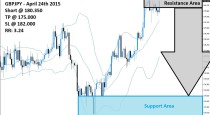
USDCAD
Short @ 1.3300
TP @ 1.2850
SL @ 1.3500
RR: 2.25
Would you like receive more such signals?
($9 per month)
 (1 votes, average: 5.00 out of 5)

Add your review