
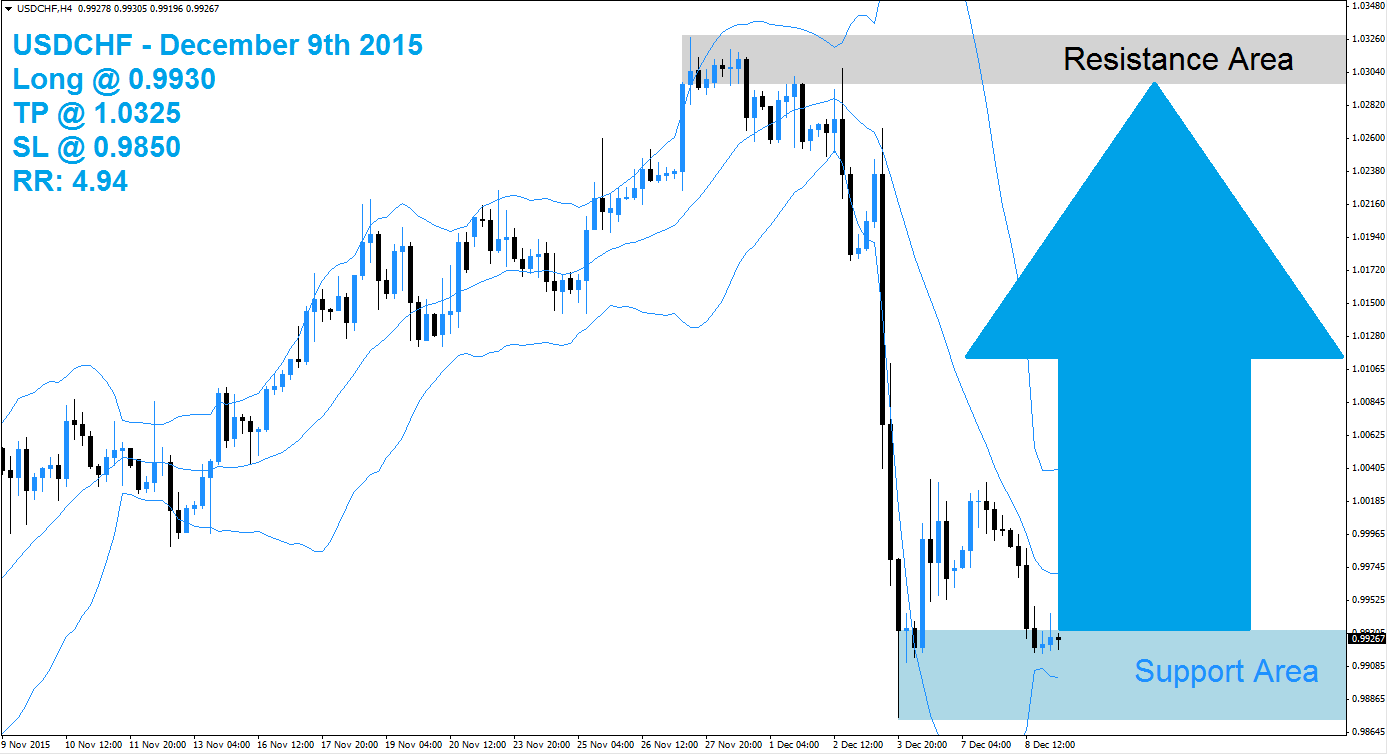
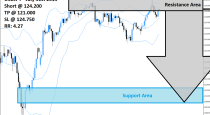
The USDCHF sold off from its resistance area, visible in light grey in the above H4 chart, down into its support area which is marked in light blue. The Bollinger Band indicator confirmed the sell-off and all three bands were sloping to the downside. The lower band has stabilized and is trading inside of its support area with the middle band and the upper band trading above of it. Price action is trading between the lower band and the middle band.
After the strong sell-off forex traders are likely to realize floating trading profits by closing their open short positions. This will lead to a short-covering rally which can push the USDCHF out of its support area. A breakout above the middle Bollinger Band can add to new net long positions and result in a rally back which can take this currency pair back into its resistance area. The upside potential is attractive with limited downside risk.
Forex traders are recommended to enter long positions at 0.9930 and below this level in order to take advantage from the expected short-covering rally. Conservative forex traders should wait for a breakout above the middle band of it Bollinger Band indicator before entering their long positions. A take profit target of 1.0325 has been set for a potential trading profit of 395 pips on the H4 Chart. More buy orders are expected after the USDCHF completes its breakout above the support area.
Forex traders should protect this trade with a stop loss level at 0.9850 for a potential trading loss of 80 pips which will result in a Risk-Reward (RR) ratio of 4.94.
USDCHF
Long @ 0.9930
TP @ 1.0325
SL @ 0.9850
RR: 4.94
 (3 votes, average: 5.00 out of 5)
Add your review