
Subscribe to this Forex Analysis (via email) – It’s FREE 😉
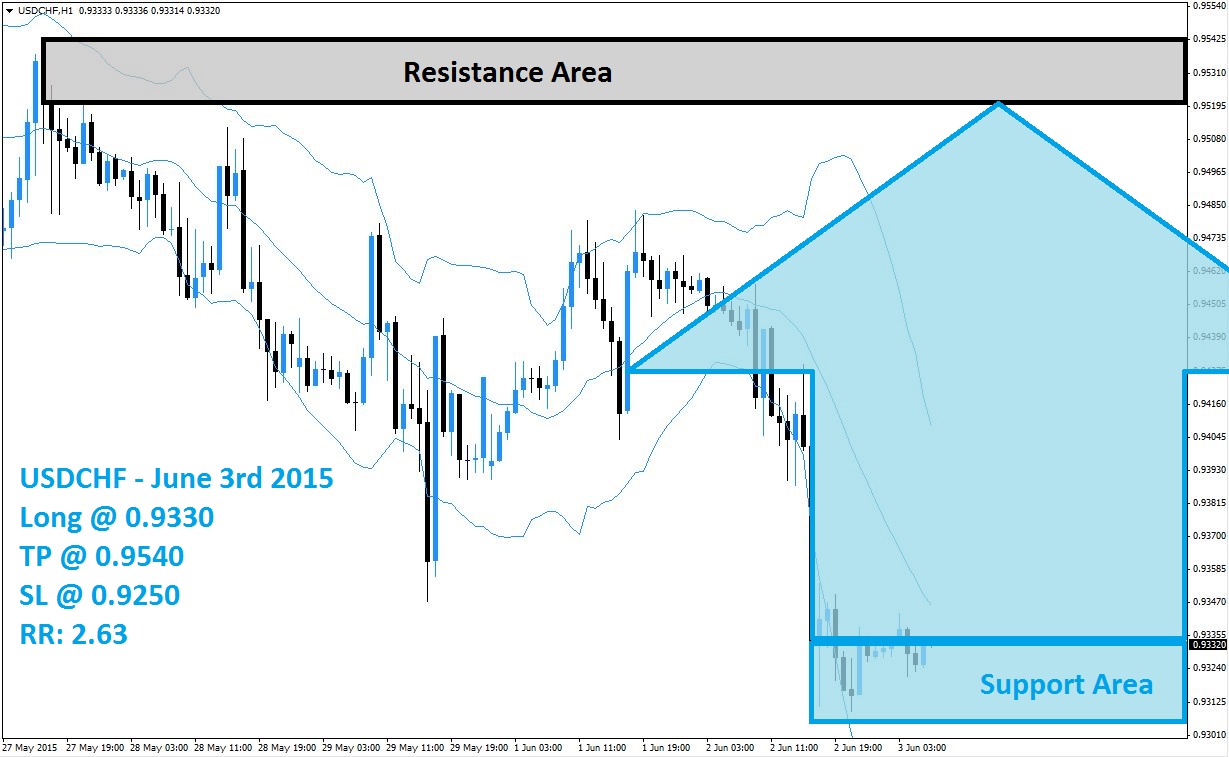
The USDCHF has ended its sell-off inside of its support area, visible in light blue in the above H1 chart, and is now trying to accumulate the necessary strength in order to breakout above its support area from where it can enter a rally. A breakout is likely to be followed by a short-covering rally as forex traders may opt to realize floating trading profits after a strong sell-off. The risk in this currency pair now clearly remains to the upside.
All three bands of the Bollinger Band indicator have support the sell-off away from its resistance area, which is visible in light grey in the above chart, and plunged the USDCHF into oversold territory. A sideways trend inside of its support area may form in order for the Bollinger Bands to catch up with price action. Forex traders should watch out for a breakout above the middle band as this would signal shift from bearish to bullish.
Forex traders are advised to position their forex portfolios with long positions in the USDCHF at 0.9330 and below as this currency pair is close to a breakout. More conservative traders are recommended to wait for a breakout above its support area before taking long positions. A take profit target of 0.9540 has been set for a potential trading profit of 210 pips on the H1 Chart. An increase in buy order sis expected once the USDCHF breaks out above its support area.
Forex traders should protect this trade with a stop loss level at 0.9250 for a potential trading loss of 80 pips which will result in a Risk-Reward (RR) ratio of 2.63.
USDCHF
Long @ 0.9330
TP @ 0.9540
SL @ 0.9250
RR: 2.63
 (No Ratings Yet)
Add your review