
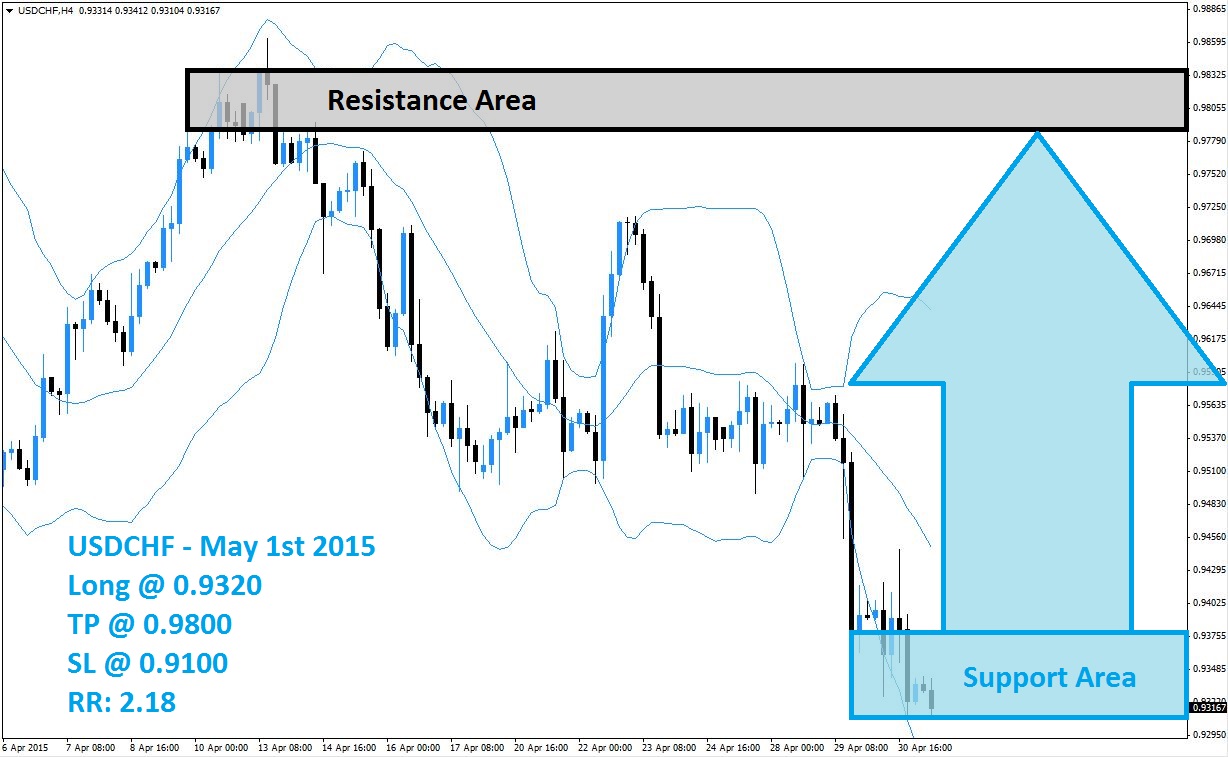
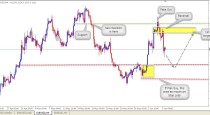
The USDCHF was faced with another leg lower as part of its sell-off from its failed breakout above its resistance area, visible in light grey in the above H4 chart. After finding support between its lower Bollinger Band and middle Bollinger Band, a sideways trend formed and the lower Bollinger Band as well as the upper Bollinger Band narrowed which increased pressure for a move. The USDCHF felt an increase in downward pressure which resulted in the sharp sell-off into a new support area, which is visible in light blue, in the above chart.
Selling pressure has now started to decrease and forex traders may opt to realize floating trading profits after a nice sell-off. This will result in a short-covering rally which can change into a bigger rally once the USDCHF breakouts above its middle Bollinger band. The USDCHF trades in extreme oversold territory which could invite a reversal. Prior to a sustained move this currency pair may find itself in another sideways trend until selling pressure will be further reduced.
Forex traders are recommended to seek out profitable long positions in their forex portfolio at 0.9320 and below. More conservative traders may want to wait for a breakout above its resistance before taking positions. A take profit target of 0.9800 is recommended for a potential trading profit of 480 pips on the H4 Chart. Once the USDCHF breaks out above its support are more buy orders can be expected which could drive the rally.
Forex traders should protect this trade with a stop loss level at 0.9100 for a potential trading loss of 220 pips which will result in a Risk-Reward (RR) ratio of 2.18.
USDCHF
Long @ 0.9320
TP @ 0.9800
SL @ 0.9100
RR: 2.18
 (No Ratings Yet)
Add your review