
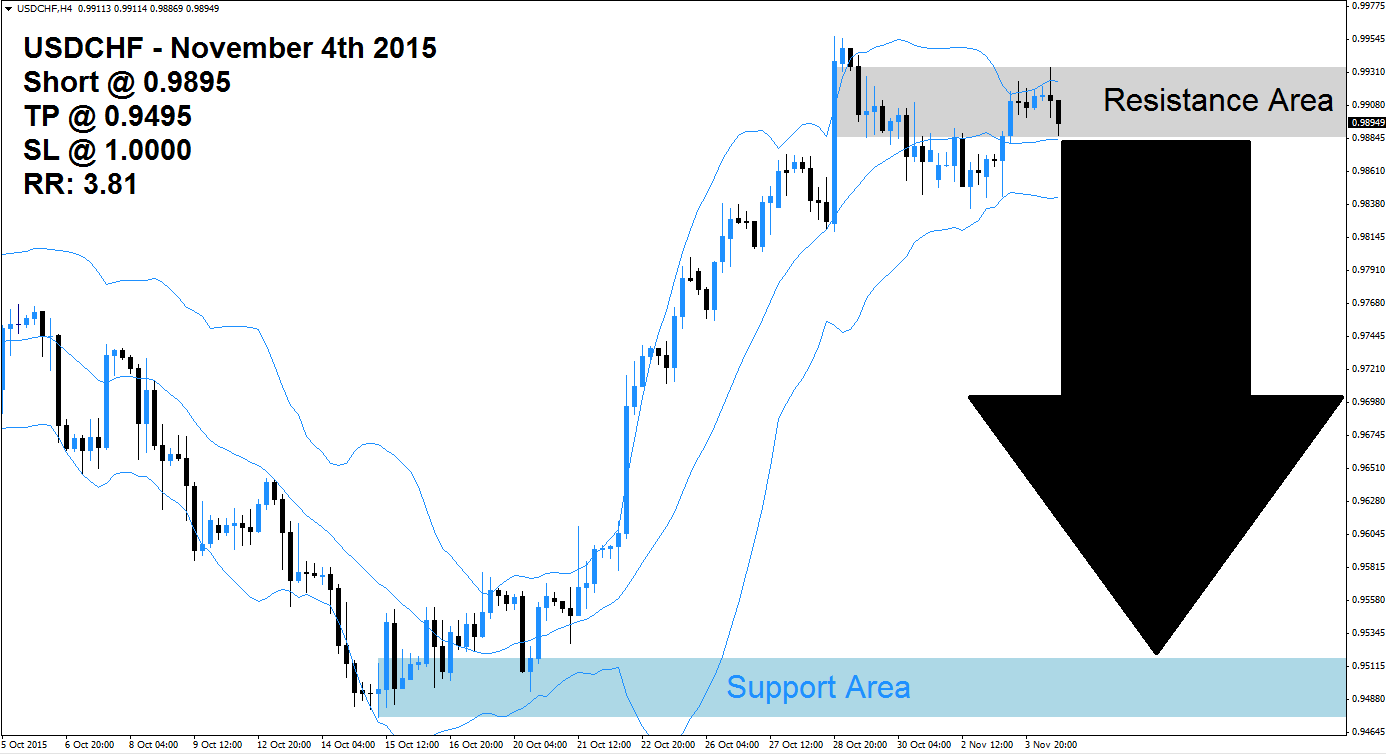
The USDCHF rallied into its resistance area which is marked in light grey in the above H4 chart. The rally was powerful enough to result into a false breakout above its resistance area. The Bollinger Band indicator confirmed the strong rally and the upper band was also able to breakout above its resistance area; both price action as well as the upper band have since dropped back inside of the resistance area which led to a pause in the rally.
The middle band of the Bollinger Band indicator is trading below the resistance area and so is the lower band. The USDCHF is trading between the middle band and the upper band. Forex traders may decide to take the sideways trend as a reason to realize floating trading profits in this currency pair which will lead to a profit taking sell-off. The sell-off is expected to take the USDCHF back down into its support area visible in light blue.
Forex traders are advised to enter short positions at 0.9895 and above in order to be well position for the expected profit taking sell-off in this currency pair and a break in the up-trend. Conservative forex traders should wait for price action to break down below the middle band of its Bollinger Band Indicator which will increase selling pressure. A take profit target of 0.9495 has been selected for a potential trading profit of 400 pips.
Forex traders should protect this trade with a stop loss level at 1.0000 for a potential trading loss of 105 pips which will result in a Risk-Reward (RR) ratio of 3.81.
USDCHF
Short @ 0.9895
TP @ 0.9495
SL @ 1.0000
RR: 3.81
Would you like receive more such signals?
($9 per month)
 (No Ratings Yet)
Add your review