
1-USDCHF trading plan.
Buy dips above 0,92 towards 0,950 and 0,957.
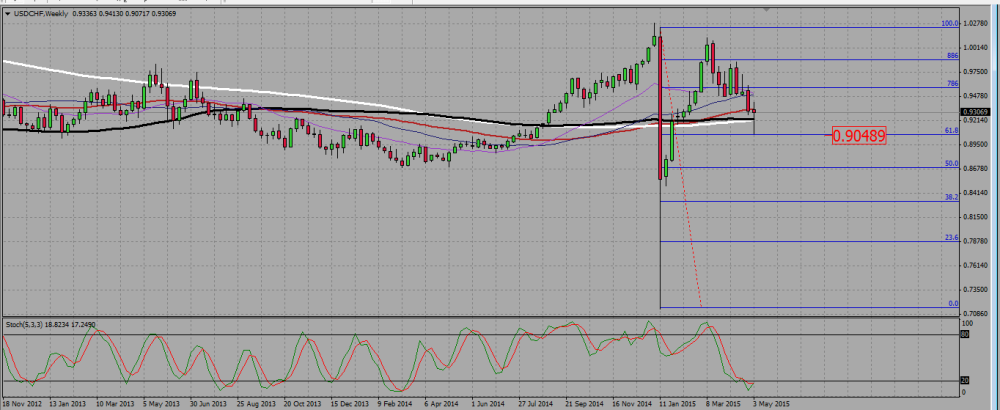
On the weekly chart, there is a pin bar, nearly a hammer, rejecting a 68,2 fib line support around 0,905, and also rejecting both the 100 and 200 SMA around 0,92.
USDCHF WEEKLY CHART.
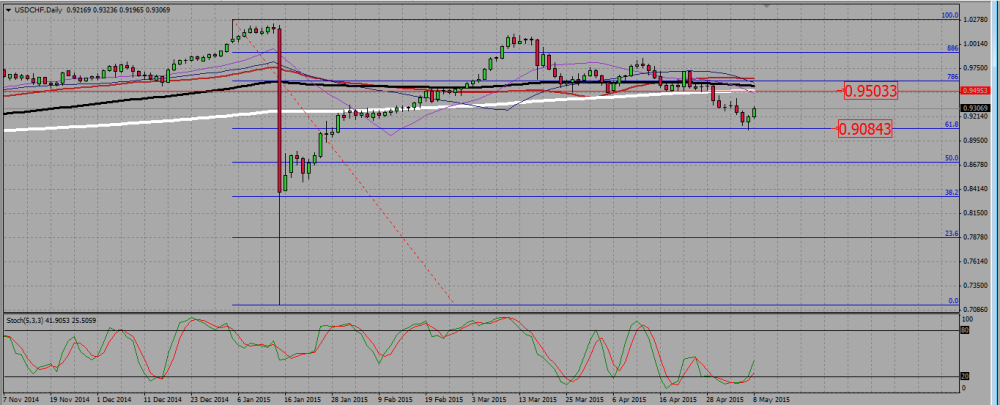
The daily shows us a hammer, and then a bullish continuation candle. The daily 200 SMA is located around 0,95 and will be our first take profit level, the 0,786 fib resistance level at 0,9575 being the second.
USDCHF DAILY CHART.
2-USDCAD trading plan.
Expect a bullish consolidation around 1,20, but keep being long term bearish and look for selling signals between 1,22 and 1,24.
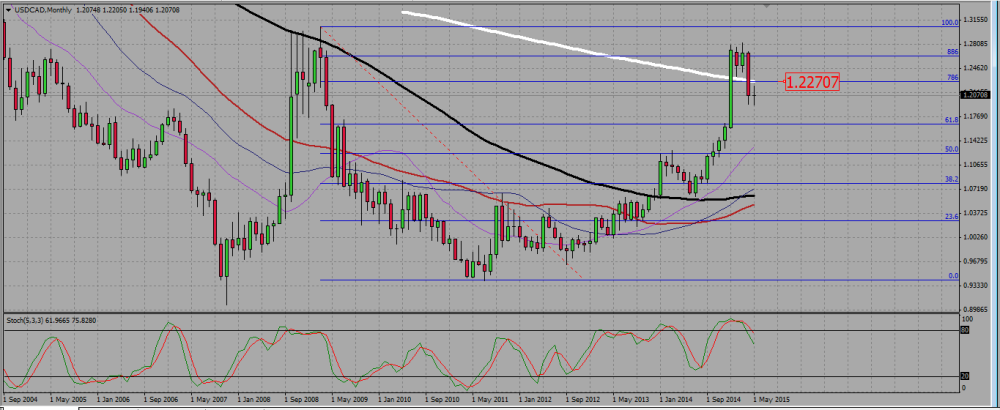
On the monthly chart the pair broke down the 200 SMA and is now retesting it.
USDCAD MONTHLY CHART.
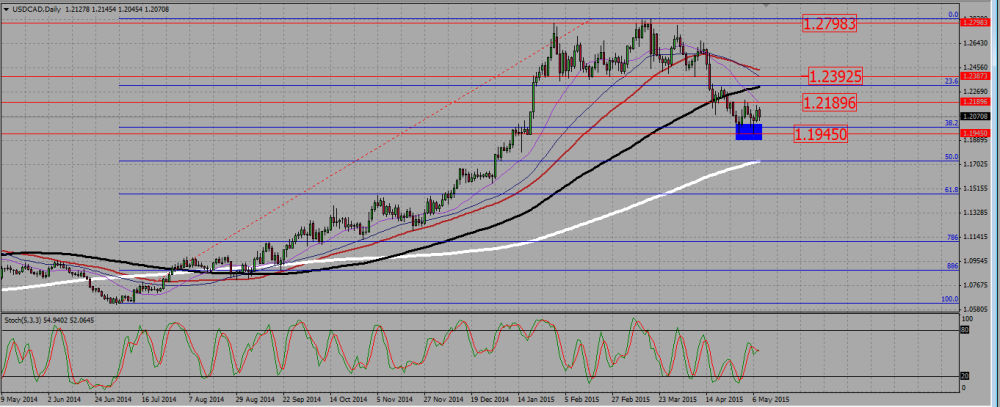
On the daily chart we see a double bottom on a fib line support and a rejection of the 1,20 support level. This means we are now in a bullish consolidation. We will look to buy signals around the 1,20 level, keeping in mind that as long as the 1,24 resistance level is not broken this is only a consolidation/retest of a bearish breakdown. We will therefore keep looking for selling signals, ideally between 1,22, where we see a daily resistance, and 1,24, which is roughly the old support of a broken range.
USDCAD DAILY CHART.
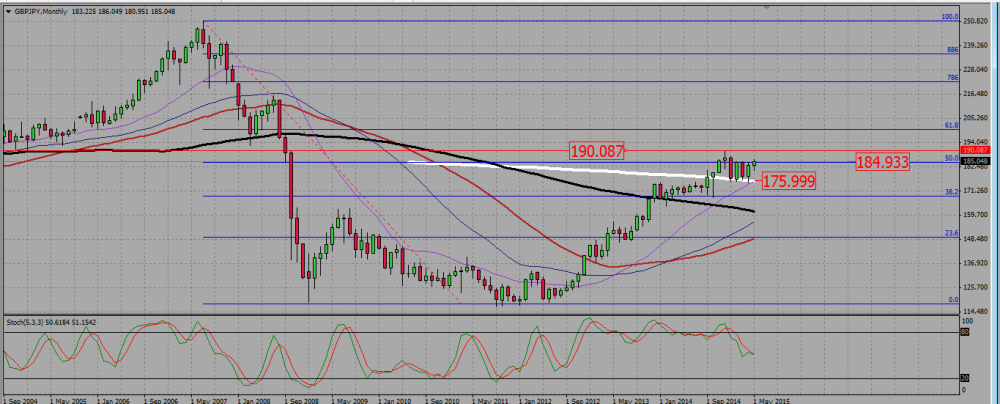
3-GBPJPY trading plan.
Buy signals above 184, aiming at 186,5 188, and then 189,5
On the monthly chart, GJ is unable to break down the 200 SMA around 175. It keeps bouncing up from it, towards a 50 fib level resistance at 185.
GBPJPY MONTHLY CHART.
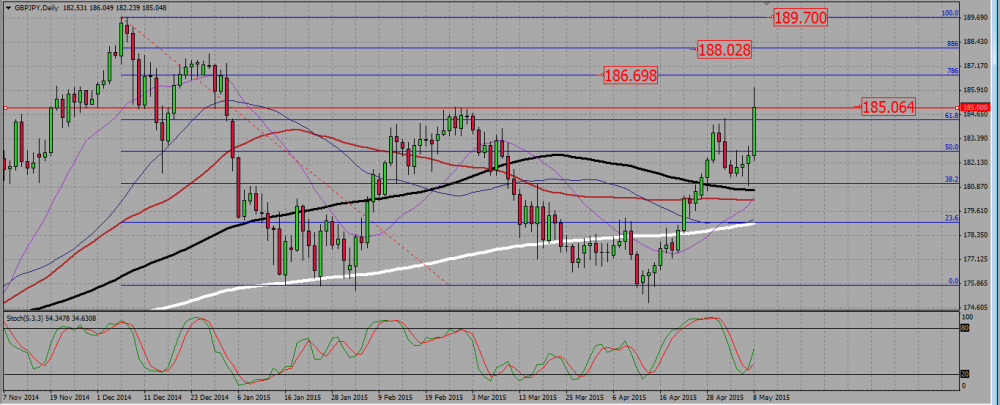
On the daily the pair trades right under the 185 level, but the last candle is a powerful bullish one that actually broke it up and we are now retesting it. We will monitor the price action at that level, expecting it to eventually break up. In that case, we will look to buy dips towards next daily fib level resistances.
GBPJPY DAILY CHART
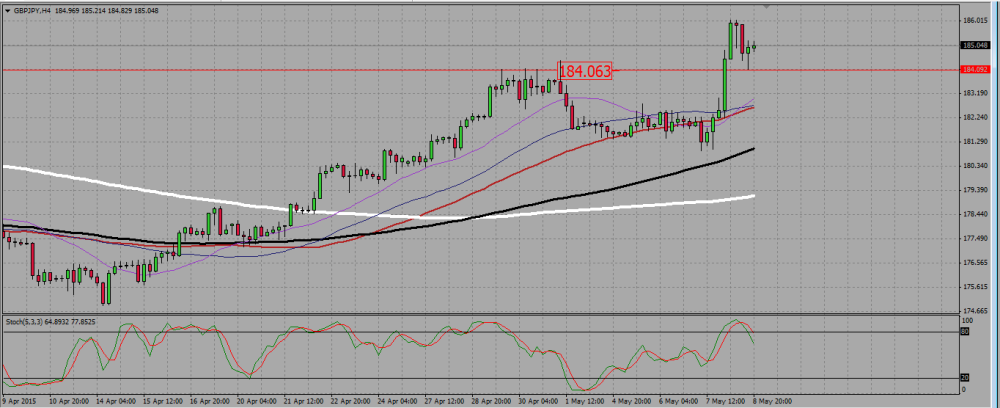
Should the pair reject the 185 resistance level we see on H4 a support around 184, where we will also be looking to buy signals.
GBPJPY H4 CHART.
 (No Ratings Yet)
Add your review