
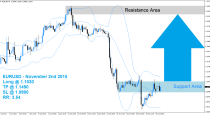
Under 106,7, sell signals. Eventually buy counter trend signals near 101,5-102, to consolidate up to 106,7, but be ready to exit at any moment.
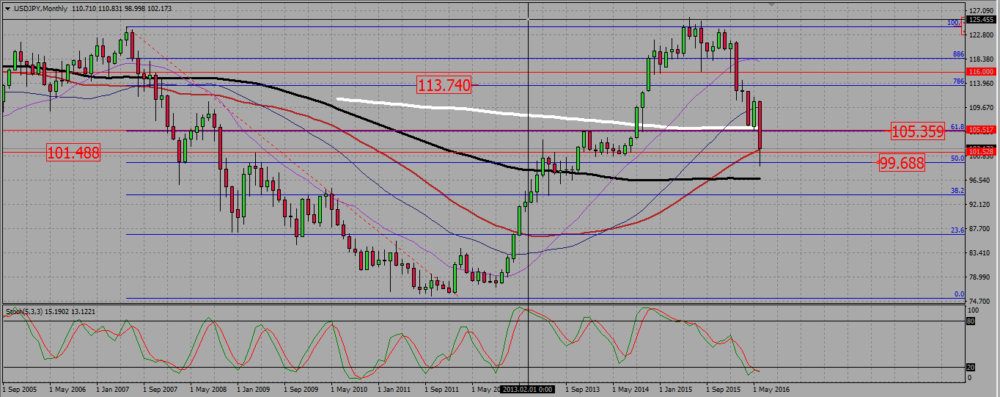
On the monthly chart the pair crushed down past the 101,5 support, managing even to make a brief journey under 100. It then went back up and stands slightly above 102. The pair has been consolidating down since the beginning of this year, making the trend bearish on shorter term charts.
USDJPY MONTHLY CHART.
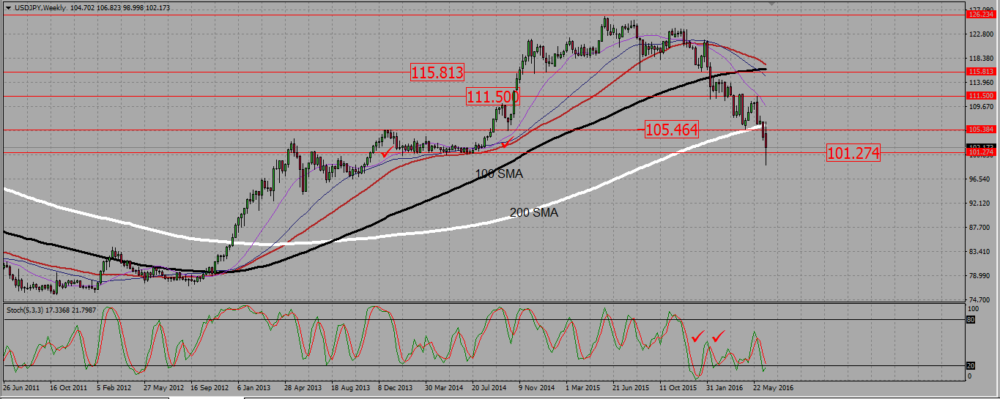
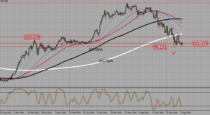
On the weekly chart, we see a bullish trend turning bearish. For the moment, the pair rejected a support zone near 101,25, but the pressure is obviously down. Please take note of the 200 SMA near 106,75. It may be a used as a resistance and as our “last line in the sand” to keep a bearish bias.
USDJPY WEEKLY CHART.
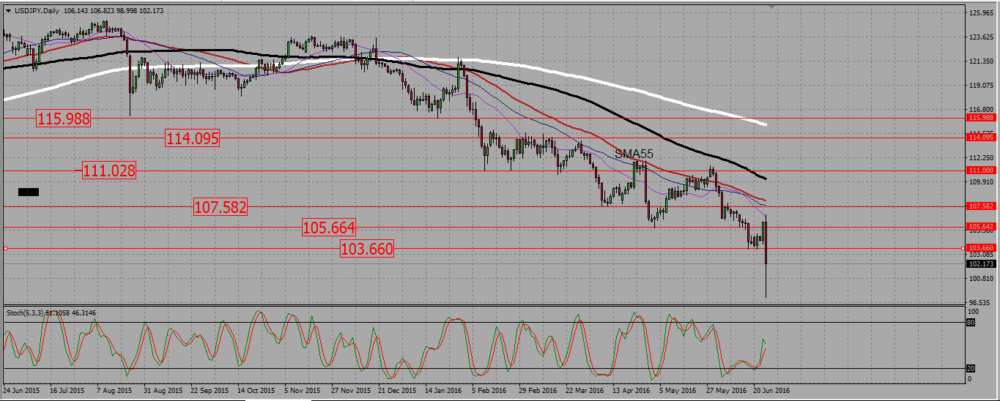
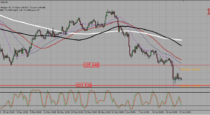
The daily chart shows us a typical downtrend, with SMAs roughly parallel and pointing down. This is a typical case of “wait for a pull back to resistance, then sell on a signal”. I drew the most obvious resistances where I will be looking for such USDJPY selling signals.
USDJPY DAILY CHART.
 (1 votes, average: 5.00 out of 5)
Add your review