Subscribe to this Weekly Forex Analysis (via email) – It’s FREE 😉
1-USDJPY trading plan
Watch price action on retest of the last monthly high around 124,5. Keep looking for buying signals above 123. If 123 is broken down, we may consolidate down to 121,5.
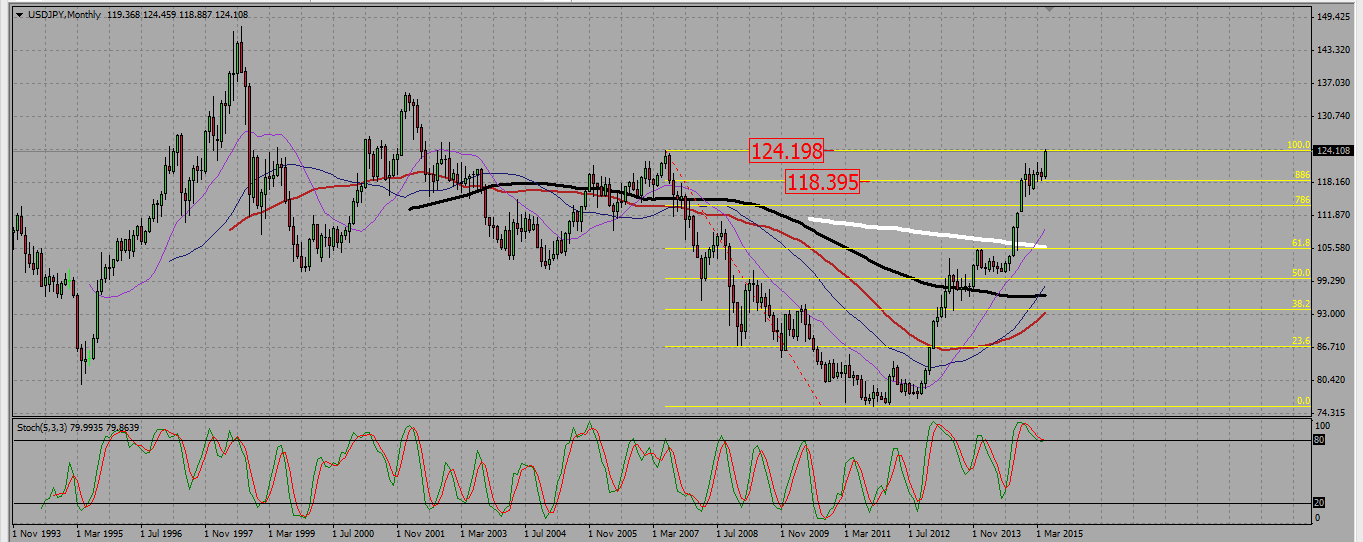
USDJPY on the monthly chart is retesting a former high around 124,5 with a powerful bullish candle. A breaking up of that high would open the way to a long term bullish move -up to 135?-.
USDJPY MONTHLY CHART.
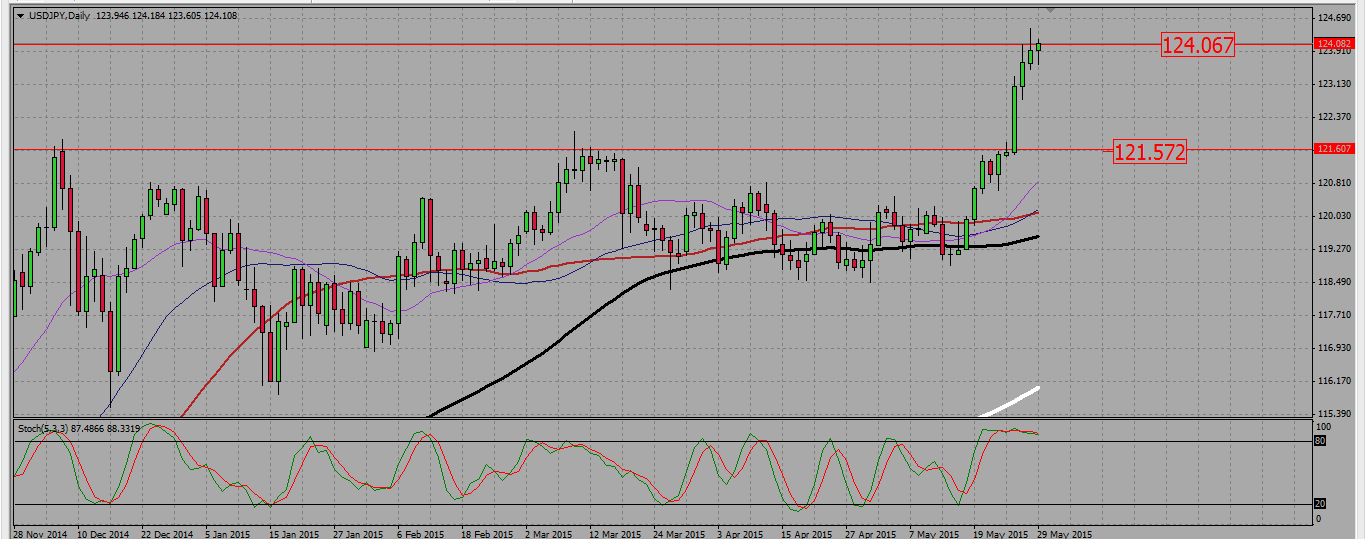
On the daily chart the pair broke a range resistance around 121,5, which has not been retested yet. Should the pair strongly reject the high around 124,5, it may consolidate even back to that point.
USDJPY DAILY CHART.
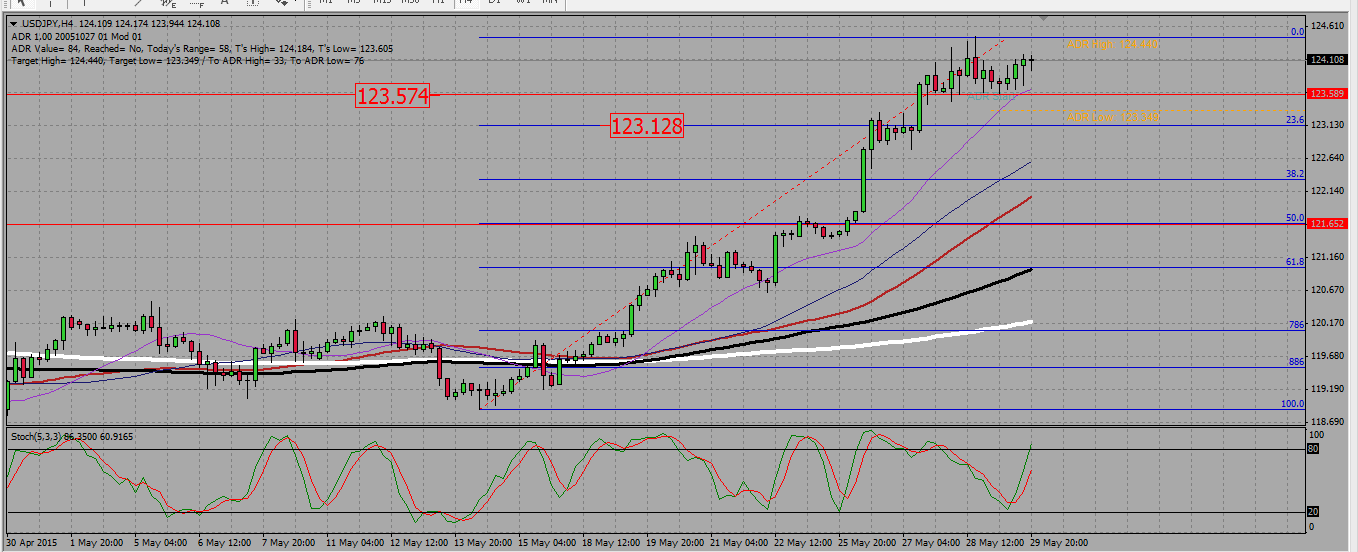
On H4, we see the pair in an uptrend, with two support levels. The first one is around 123,5, the second around 123. Both are great places to look for buying signals should the pair consolidate mildly from the high making another attempt at 124,5
USDJPY H4 CHART.
2-NZDUSD trading plan.
The pair just broke a monthly support around 0,725. Look for selling signals under 0,73, aiming at the next monthly fibonacci support level at 0,687. There may be a counter trend bullish consolidation first, as the pair is near the 0,7 psychological level and as NZD banks are closed on Monday.
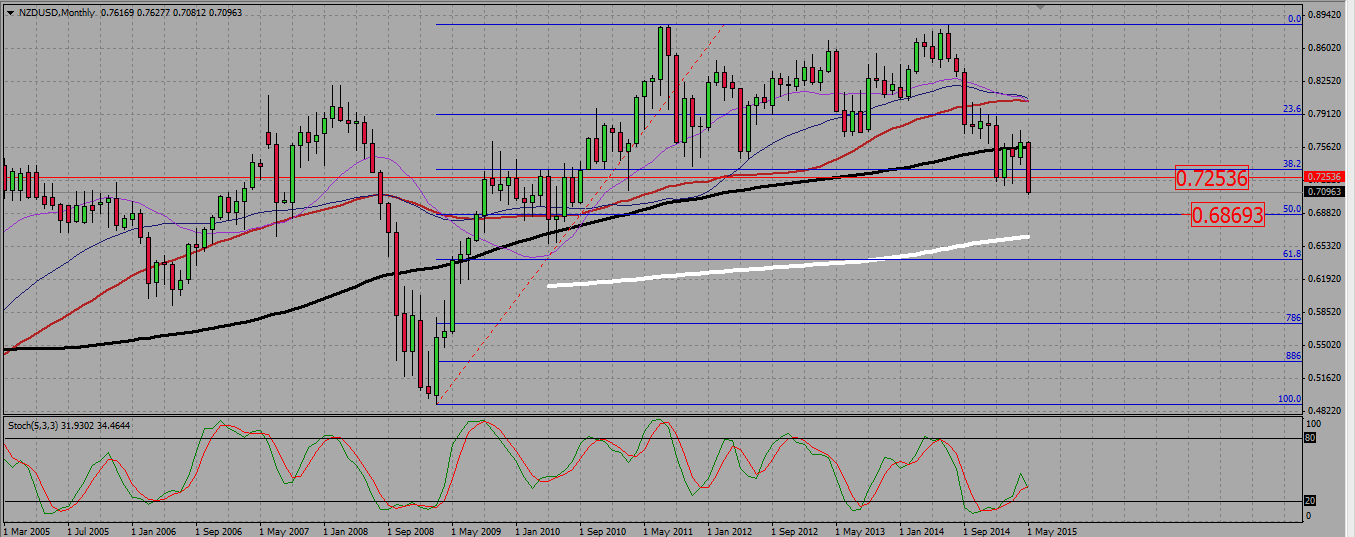
On the monthly time frame we have a brutal bearish candle that broke a 38,2 fib line and a monthly support around 0,73. The 50 fib line is next at 0,687 and will be our profit level.
NZDUSD MONTHLY CHART.
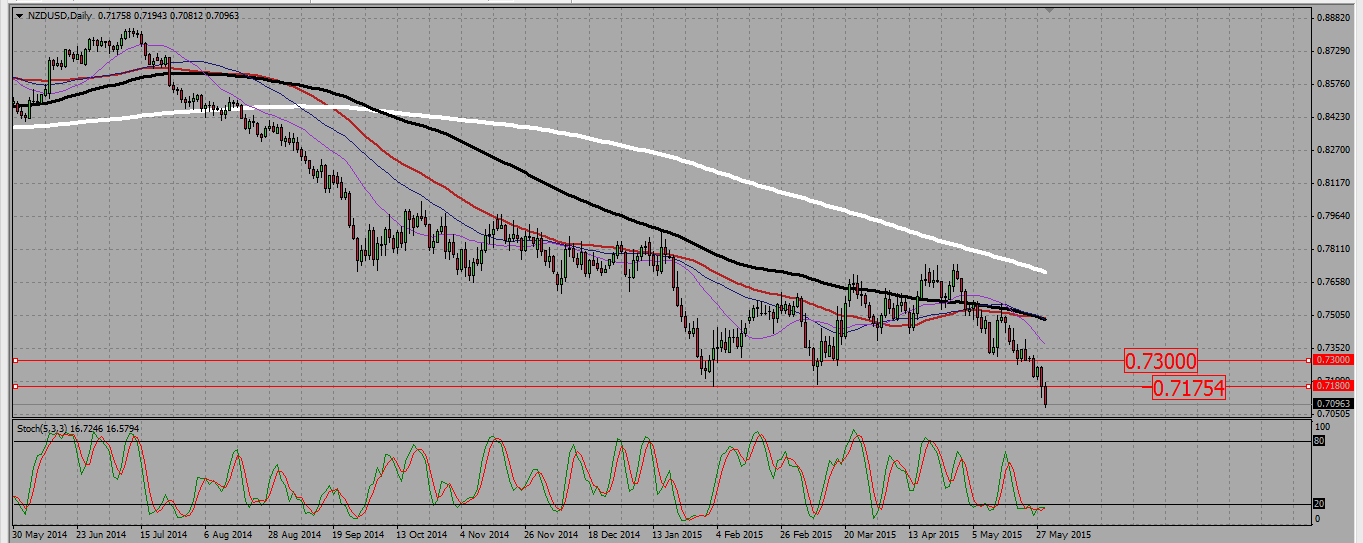
The daily chart shows the pair has broken two important supports that now stand resistances : the 0,717 and the 0,73. That last resistance (0,73) is the level we do not want to see broken up in order to keep a bearish bias on that pair.
NZDUSD DAILY CHART.
3-EURAUD trading plan.
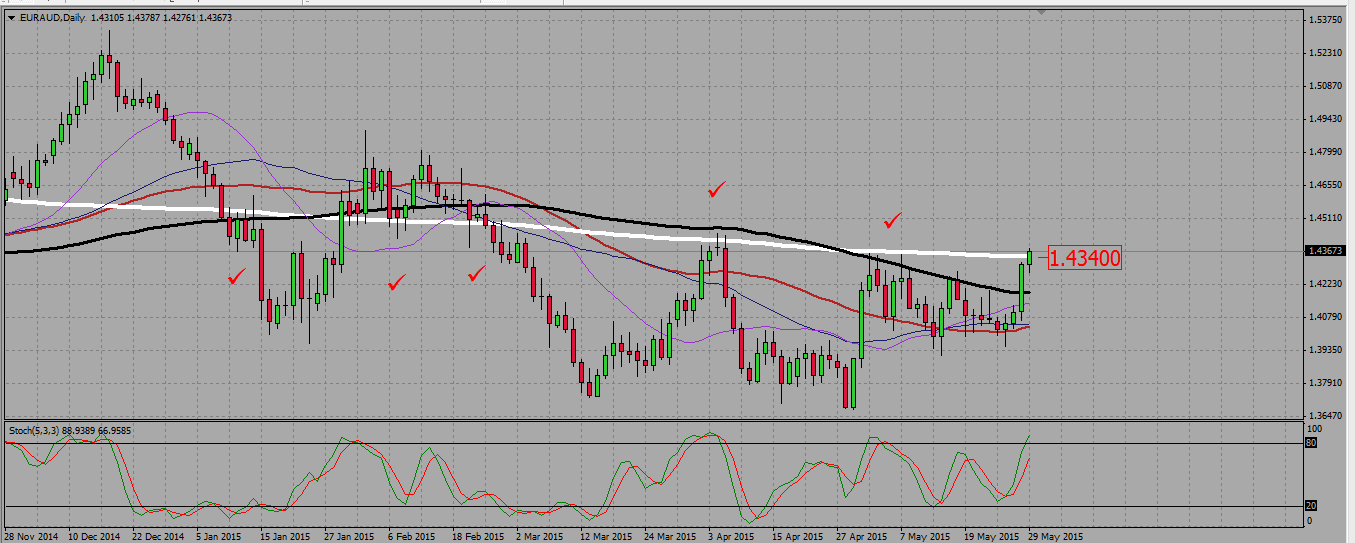
Look for buying signals above 1,423. Watch price action around the daily 200 SMA. A confirmation of the breaking up would open the way to a solid bullish move, with a first potential target around 1,483.
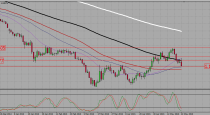
On the daily chart we see the 200 SMA acting as a strong level of support/resistance (read more about S&R trading) the pair ended the week with a slight breaking up of that SMA, trading around 1,436 when the 200 moving average is located at 1,434.
EURAUD DAILY CHART.
The weekly chart shows a strong potential for a bullish move, with the beginning of a bullish trend in 2012, that turned bearish in 2013 around 1,59 and consolidated back to the 50 fib retracement support around 1,374, before reversing bullish again by the beginning of this year. We broke up the 38,2 fib line at 1,423 and this is the support above which we will keep a short term bullish bias.
EURAUD WEEKLY CHART.

Subscribe to this Weekly Forex Analysis (via email) – It’s FREE 😉
 (No Ratings Yet)