
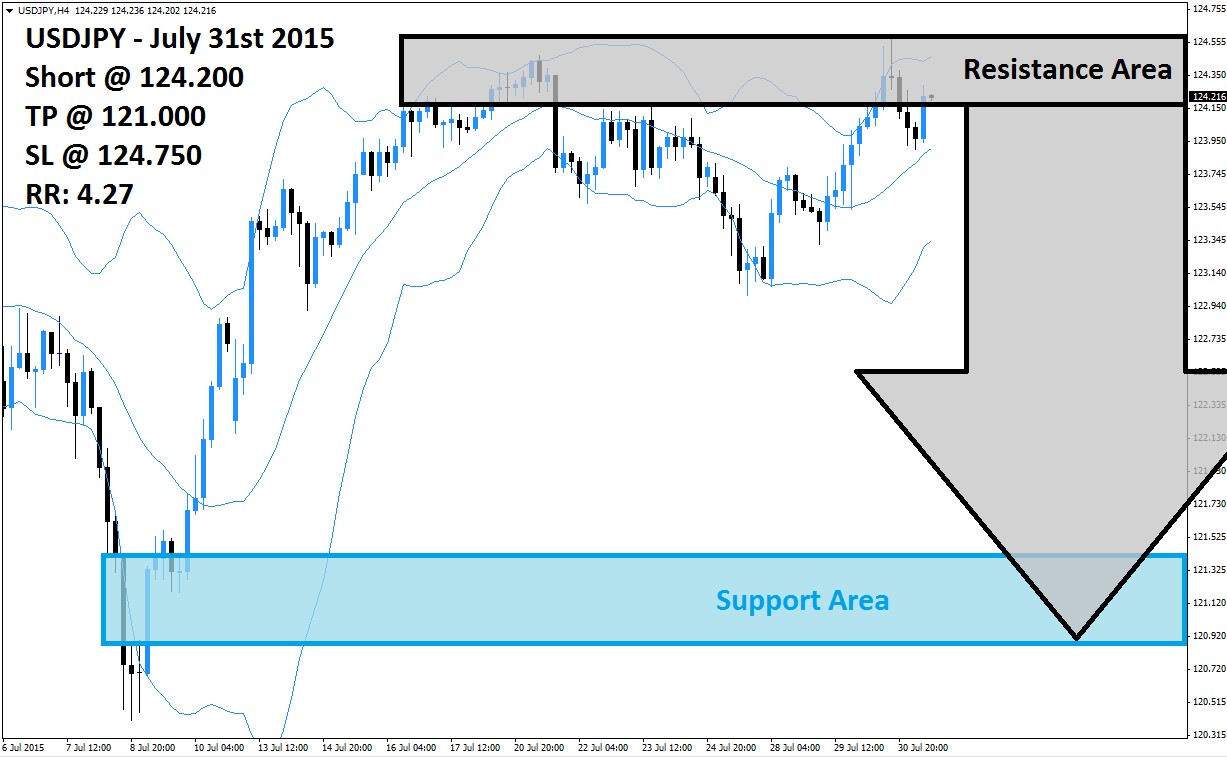
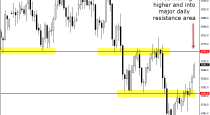
The USDJPY has formed a double top formation inside of its resistance area which is marked in light grey in the above H4 chart. This currency pair was able to reverse its preceding sell-off and is now trading with a bearish chart pattern driving price action. The Bollinger Band Indicator has not traded above its resistance area and the USDJPY is expected to enter a new sell-off after breaking down below the middle band of its Bollinger Band Indicator.
The double top formation may lead forex traders to realize floating trading profits by closing their long positions. This could provide enough selling pressure for a breakdown below the middle band of its Bollinger Band Indicator. A breakdown below the intra-day low which separates the intra-day highs will increase momentum which will fuel the sell-off in the USDJPY until this currency pair will reach its support area visible in light blue.
Forex traders are advised to seek short positions in this currency pair at 124.200 and above in order to be positioned for the expected sell-off. Conservative forex traders are advised to wait for the USDJPY to break down below the middle band of its Bollinger Band Indicator which will further decrease risk in this short trade. A take profit target of 121.000 has been selected for a potential trading profit of 320 pips.
Forex traders should protect this trade with a stop loss level at 124.750 for a potential trading loss of 55 pips which will result in a Risk-Reward (RR) ratio of 4.27.
USDJPY
Short @ 124.200
TP @ 121.000
SL @ 124.750
RR: 4.27
 (No Ratings Yet)
Add your review