
Above 105,25 105,5 buy signals long term. If the pair breaks down 105, sell signals towards 101,5, but no lower for it may be the Bank of Japan is intervening near 101.
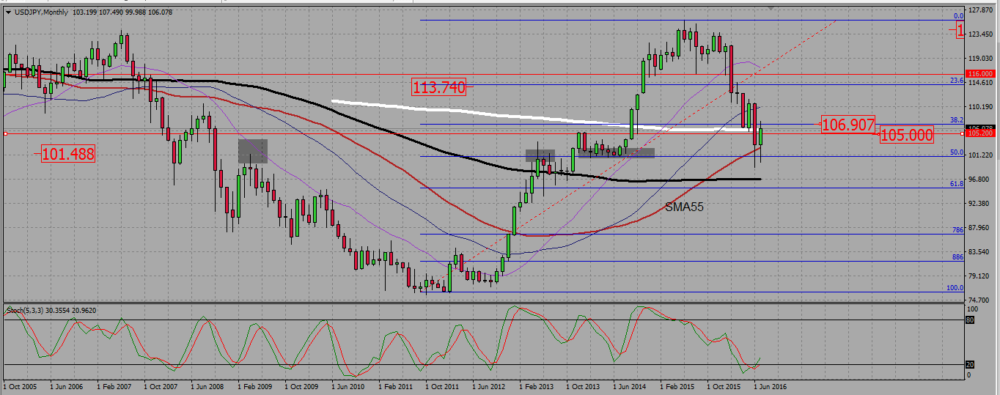
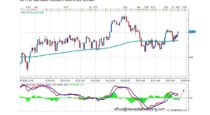
On the monthly chart, the 200 and 100 SMA are flat. After a strong bullish move between 2012 -2015, the pair started to consolidate down in July 2015. It reached and rejected twice the 50 Fibonaci retracement support near 101. The pair is now going back up, and even managed to break a resistance near 105, but trades now right under another resistance area, with the 200 SMA near 105,8, and the 38,2 Fibonacci resistance near 106,9.
USDJPY MONTHLY CHART.
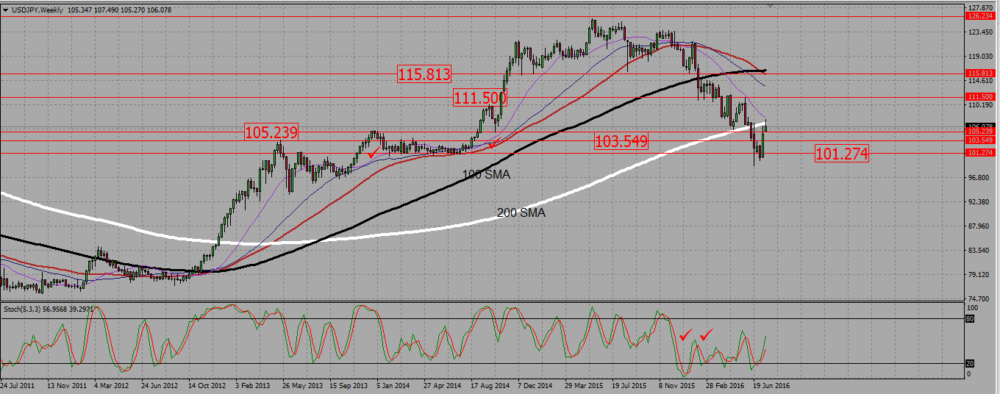
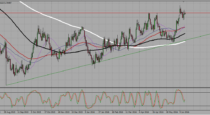
There is an uptrend on the weekly chart : the 100 and 200 SMAs are going up, the 100 being above the 200 and parallel to it. Shorter terms SMAs are rather messy, reflecting the bearish consolidation that took place since July last year. But as the pair bounced twice from a 50 Fibonacci monthly support level, that consolidation may be over (thanks to Bank of Japan?). The pair on its way back north managed to break up a resistance near 105,2, but is now blocked again by the weekly 200 SMA near 106,7, thus very close to the 38,2 Fibonacci resistance we saw on the monthly chart..
As there is a bullish trend on that chart, I prefer to think long, but the presence of those two strong resistances just above does not allow to just buy USDJPY there; I prefer to wait for a break out – pull back – confirmation type of move, and the daily chart is telling us such a move may just be happening.
USDJPY WEEKLY CHART.
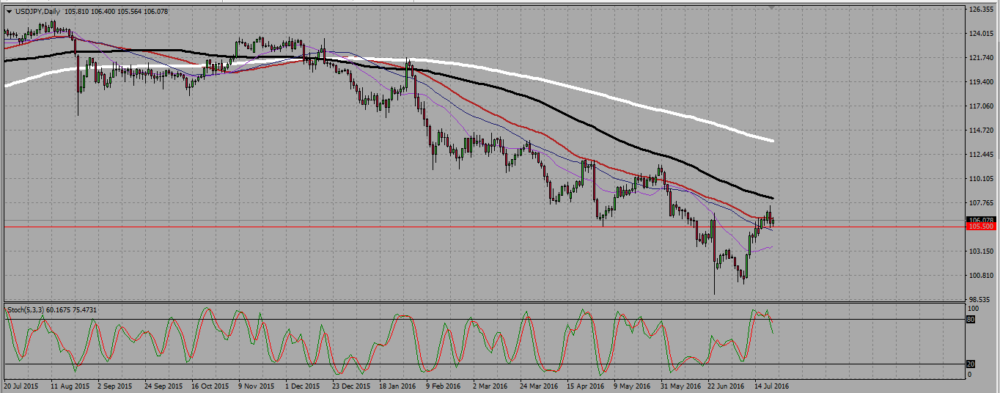
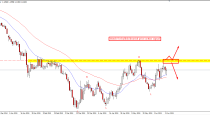
The daily chart is clearly in a downtrend, which is not surprising as the pair has been consolidating south since July. A the weekly chart is in an uptrend, and as it strongly rejected a 50 Fibonacci monthly support, I prefer to buy it, all the more as the par made a W kind of move usually meaning a bullish reversal. (see other inficators in our Forex Shop)
However, there is a bearish engulfing candle on Thursday. It retested the broken resistance near 105, but as we are on this chart in a downtrend, thre is a small possibility for the pair to break down back that 105 level. In such a case, it will be worth to sell the break down, for it may mean a third retest of the support near 101.
USDJPY DAILY CHART.
 (1 votes, average: 5.00 out of 5)
Add your review