
Watch 111, 111,5 and sell signal there long term. Buy confirmed break up of 111,5 towards 114 and 116.
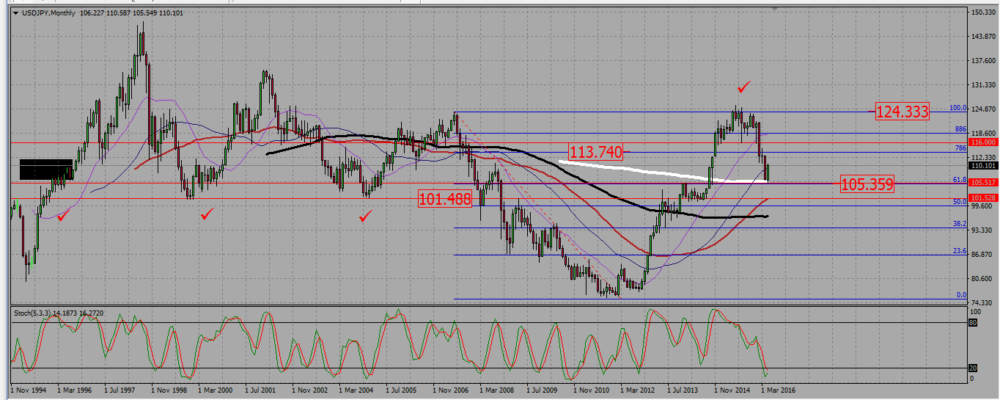
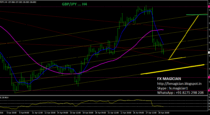
On the monthly chart, the pair is strongly bouncing from a major support around 105,5. The pair is rather in a no trend situation, although short term SMAs are pointing up.
USDJPY MONTHLY CHART.
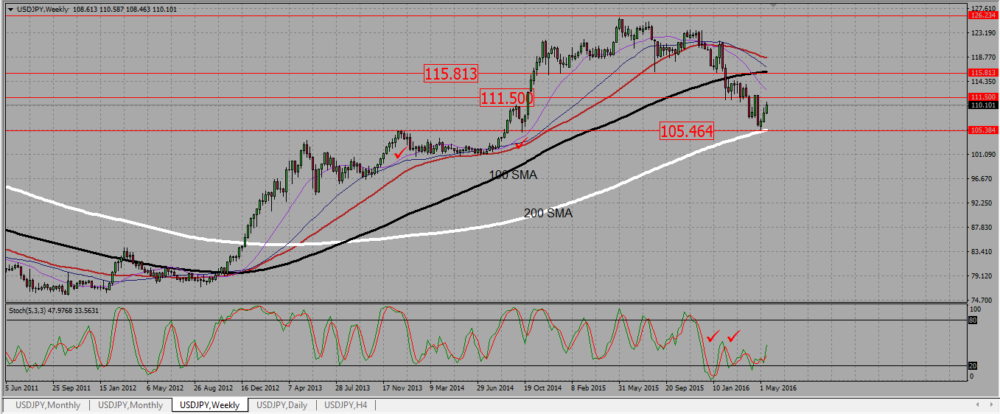
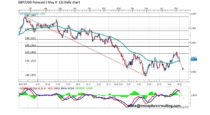
On the weekly chart, we see a bullish trend. However the pair started a bearish consolidation after failing to break a resistance around 126 on May last year. Does the rejection of the monthly support around 125 mean we are back into a bullish trend, or is it just a rally before consolidating down again? It is too early to say, but we see a resistance around 111,5. How the pair reacts at that level will be a strong indication about future moves.
USDJPY WEEKLY CHART.
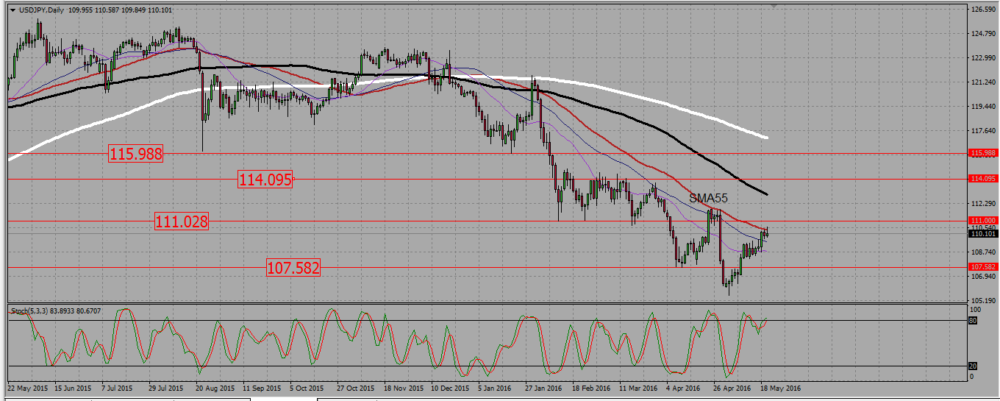
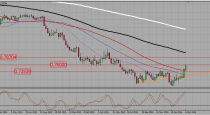
On the daily chart the pair is in a down trend. The resistance zone we noticed around 111,5 on the weekly chart looks here to start around 111, and we need to consider the whole zone -111 to 11,5- to be resistance. If the pair breaks it up, the next resistance and our take profit levels will be 114 and then 116. On the other side, a rejection of that resistance area would probably mean a retest of 105,5. Pay also attention to the daily 55 SMA: it has already been a resistance once, and the pair is having trouble to break it up. I would consider selling a signal there.
USDJPY DAILY CHART.
 (2 votes, average: 5.00 out of 5)
Add your review