
Forex Trading with Fibonacci Tools
Fibonacci sequence of numbers, especially in the context of trading is met with doubts, apprehensions and a bit of mystical feel to it. Discovered by Leonardo (Leonardo Pisano Bigollo) of Pisa, the most important Fibonacci numbers are 61.8% (or 0.618) followed by 38.2% (0.382) and their variations such as 1.618, 1.272 and so on.
Due to the fact that Fibonacci trading is one of the most commonly used methods to trade, it has become a kind of self full-filling prophecy. For example, when price tends to trade near 61.8%, due to the sheer number of traders expecting to see a reversal, tend to short the currency pair, as would many other traders. This in itself becomes a self full-filling prophecy rather than having to do anything magical or mystical about it.
In the MT4 trading platform, the various Fibonacci tools can be accessed by clicking on Insert>Fibonacci which displays the various tools that are available.
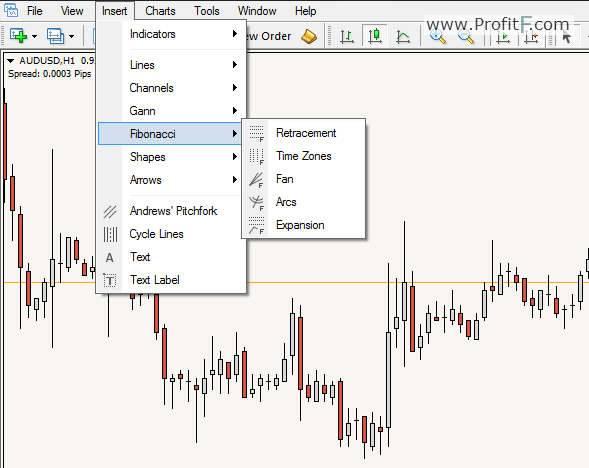
In most trading platforms, there are many Fibonacci Trading tools that are available. The most commonly used Fibonacci tools are:
Let’s take a closer look into each of these tools and how they can help the trader to form a bias in trading.
How to use the Fibonacci retracement tool?
To plot the Fibonacci levels, follow the steps below.
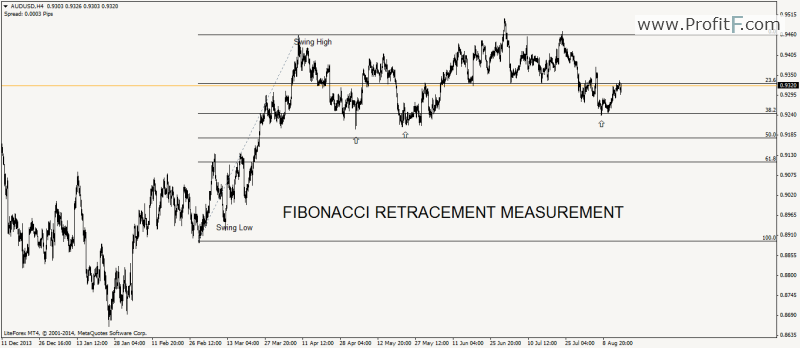
In the chart above we have plotted the Fibonacci retracement tool to an uptrend by plotting the tool from the bottom swing low to the left to the upper swing high on the right. This swing measurement gives us the fib levels of the swing move.
Notice how, after making the swing high, price bounces off constantly from the 61.8% Fibonacci level.
Retracements & Continuations
When using the Fibonacci retracement tool, it is important to bear in mind that the levels do not explicitly specify retracements. There are many instances where price breaks any of the Fibonacci levels and continues in the direction of the previous trend momentum. The best way to use the Fibonacci retracement tool is to apply to trend lines and the subsequent swing moves.
The chart below shows how an uptrend was first identified and the Fibonacci retracement tool was applied to the swing move. After the trend line was broken, notice how price bounced to 38.2% Fib level before reversing?
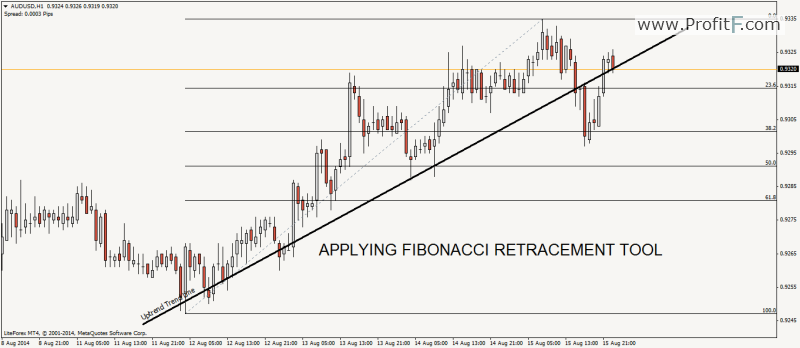
While most textbooks and websites usually tend to show Fibonacci retracement tool as a standalone tool for trading, it is most effective when used in combination with other forms of technical analysis.
Fibonacci Extension Tools
What are they and how to use them?
The Fibonacci extension tools are used to measure the possible fib levels that prices can attain after a retracement. The best way to use Fibonacci extension is to use them in tandem with the retracement tool. Unlike the retracement tool, the Fibonacci extension tool makes use of only 0.618 ad 1.1618 levels. Of course, traders tend to use their own custom levels as well.
Plotting the Fibonacci extension tool is a bit different as it takes into account 3 swing points. High/Low/High or Low/High/Low.
In the chart below, we have plotted the Fibonacci extension tool within a minor swing point of the larger leg. Notice the swing points that were selected. Point A indicates the first major retracement within the down trend. Point B indicates the end of the downward trend. Point C is where price retraced 61.8% of the previous downtrend. So by applying the Fibonacci extension tool to A, B and C, we get the targets of 1.618 and 0.618
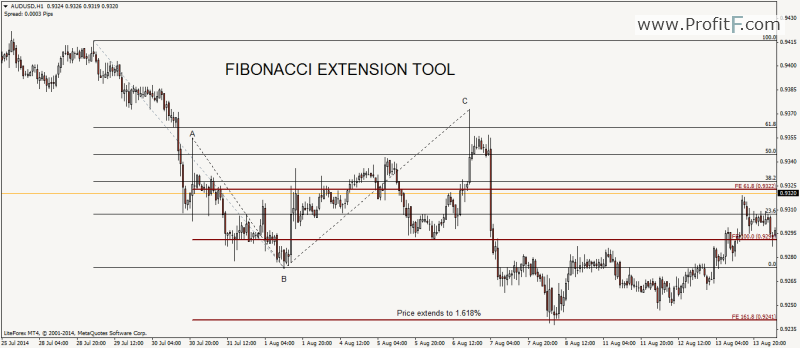
In the example above, we notice that after price retraced to point C at 61.8% of the previous downward move, we notice a large wick being left in price. This is a clear indication that there are many buyers at the levels above. Therefore, price continued to drop. If we use only the Fibonacci retracement tool, it wouldn’t have given us anything much as to where price could reach. But when we apply the extension tool, we get a key price level at 1.618% of the Fibonacci extension tool. Subsequently, price dropped to the 1.618% of the Fibonacci extension tool and saw a sharp reversal and a subsequent rally from there on.
As we see from the above example, using the Fibonacci retracement tool along with the expansion or extension tool gives a more probable trade bias.
Fibonacci Time Zones
The Fibonacci time zones are constructed differently. Unlike the previously mentioned to Fibonacci tools that is used to measure price and swing moves, the Fibonacci timezone tool, going by its name indicates key time levels where price could change its trend.
To plot the Fibonacci time zones, simply connect two highs or two lows. The default Fibonacci timezone tool in the MT4 trading platform has various levels. But the most commonly used levels in Fibonacci Time zone are 0.618 and 1.618, besides 0 and 1.
In the chart below, we make use of the same previous chart but apply Fibonacci Timezones to the two swing points of A and C, with values of 0.618 and 1.618. If you observe closely, notice how after price crossed the 0.618% Fib time zone level price was in a short term downtrend and after crossing the 1.618% Fib timezone level, price started to rally.
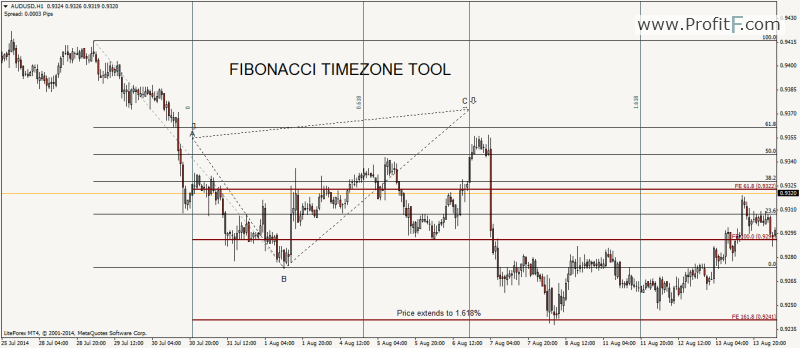
Using the chart above, we notice a new buy signal being triggered with the help of the Fibonacci time zone. After price crossed the 1.618 timezone level, and taking into consideration price reaching the previous short trade target of 1.618% of the Fibonacci expansion tool, a long position could have been initiated, with the targets of 100% of the Fibonacci expansion tool followed by 61.8%.
From the above article, we notice how Fibonacci tools can be used to build a complete trading system. Despite various texts that tend to depict Fibonacci tools as an independent indicator, using them together offers a much clearer perspective of the markets. When combined with other price action trading methods such as support/resistance, trend lines and so on, the Fibonacci set of tools can offer an alternative way of trading the markets.
Add your review