
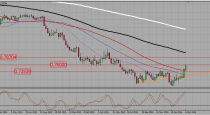
1-AUDUSD trading plan.
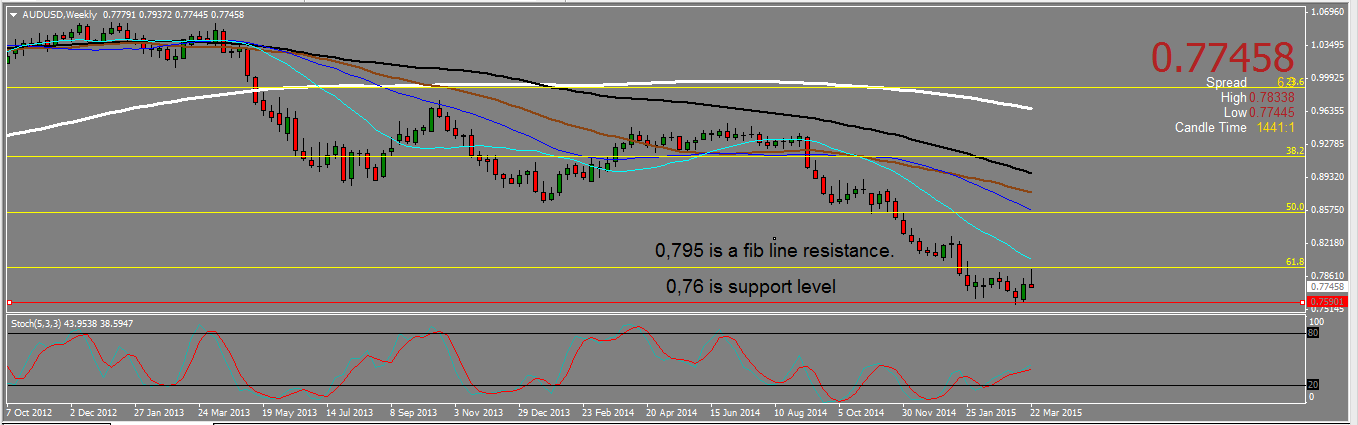
Look for short signal up to 0,795. Mind the 0,76 support level. Should it break, aim for 0,70.
The weekly AUDUSD chart show us a range -roughly- between 0,795 and 0,76. The weekly candle is a gravestone doji/shooting star falling from the ,79 resistance and that means we are probably going to retest the support around 0,76.
AU WEEKLY CHART.
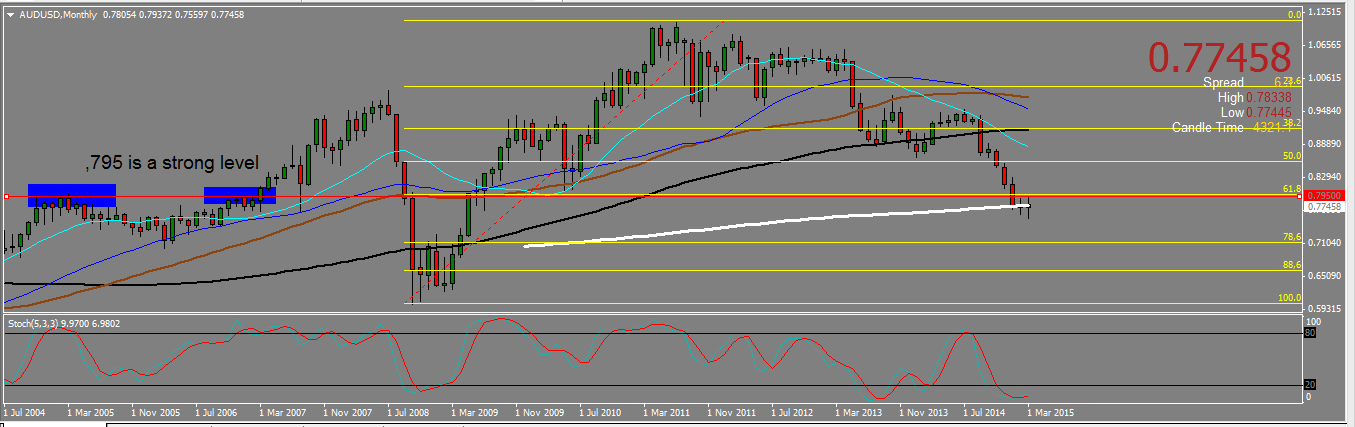
The monthly chart shows the pair being trading at SMA200 level around 0,76, which probably explains the support we see at that level. As the 0,795 resistance level looks rather strong, we expect the SMA200 to be eventually broken down, opening the way to the next fib support, that is the ,786 retracement level around 0,70.
AU MONTHLY CHART.
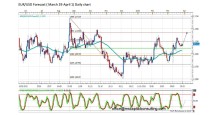
2-USDCAD trading plan.
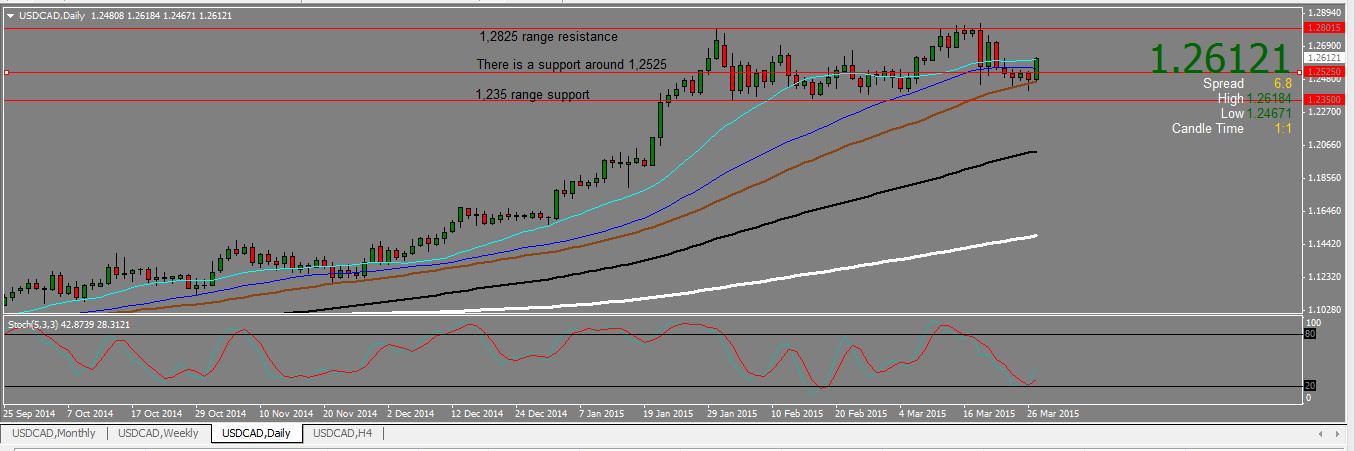
Buy dips above 1,2475 (watch 1,25 and 1,2525 levels for bullish signals) aiming for 1,2825 and above.
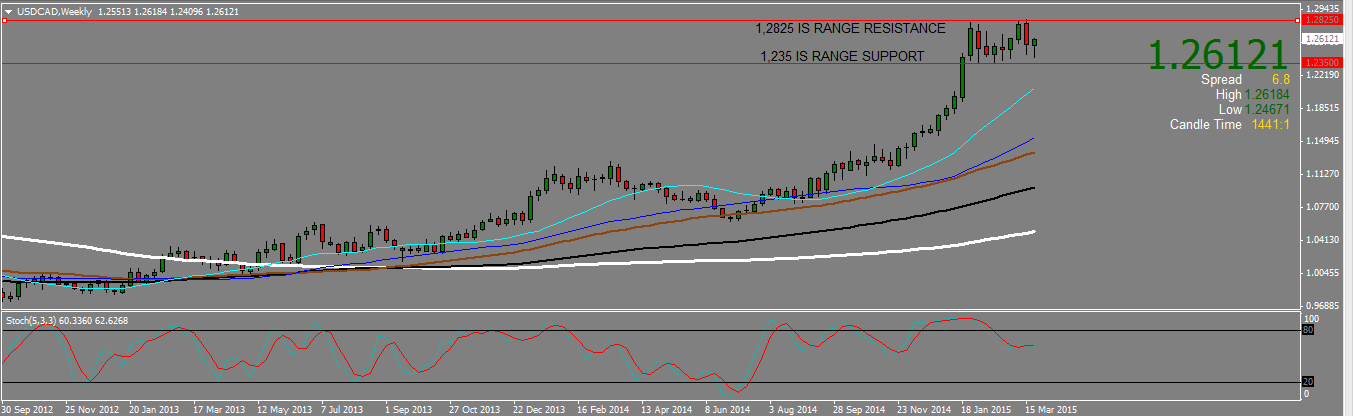
The loonie has been ranging for eight weeks, but last weekly candle, rising from the support with a long down wick tells us the pair is probably heading for the range resistance at 1,2825.
USDCAD WEEKLY CHART.
The daily chart shows a bullish engulfing candle (download ENGULFING-BAR indicator here>) rising from the SMA55, now a support at 1,2475 ; SMA40 has also been broken up in the process. As the candle is a bullish engulfing, we expect the move up to continue and will buy pull back as long as we are above that Daily SMA55. 1,25 and 1,2525 levels (see chart) are supports from which the pair may also bounce up. We will first target the range resistance at 1,2825, but should that level be reached, we will let some part of the trade opened in case it would be finally broken up.
USDCAD DAILY CHART.
3-EURJPY trading plan.
Buy above 131 on a retest after a bullish break out towards 134. Sell rallies under 131 towards 128.
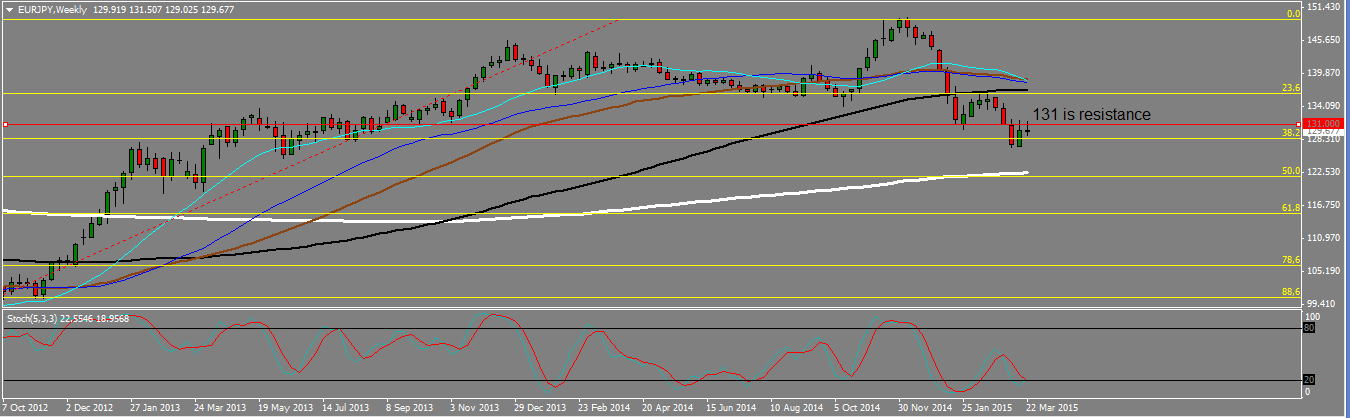
On the weekly EJ seems to be rejecting for the second time a former broken support around 131 . We also broke down the 130 level. The last weekly candle is however a doji, and that means an indecision : the pair may still bounce up. This may be due to the monthly SMA200 that stands as a support around 128. Note that the pair made a lower high and a lower low.
EJ WEEKLY CHART.
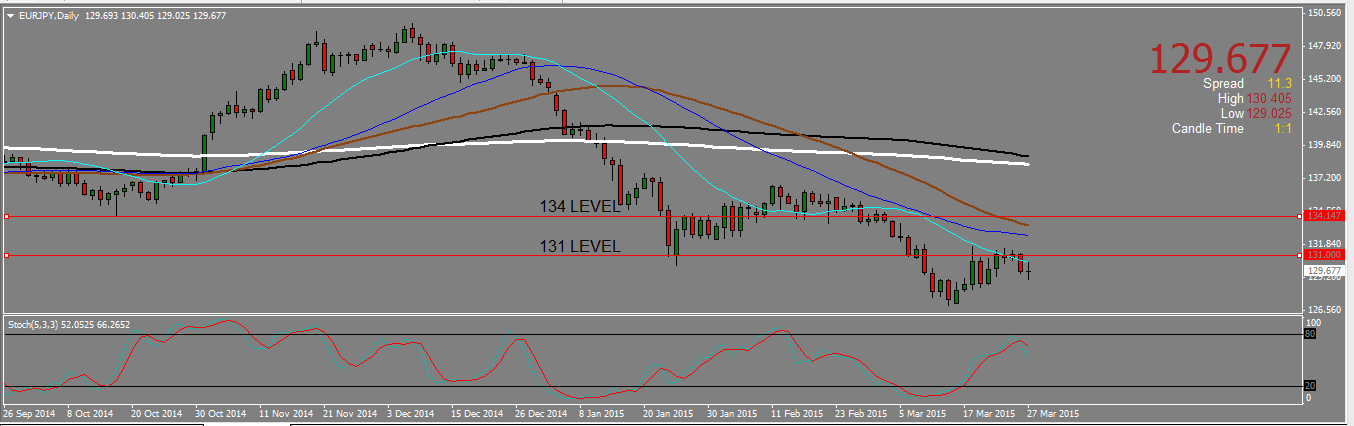
The daily chart shows us a clean break down of the 131 level on Thursday, followed by a doji on Friday. All SMAs are now starting to point down. This is why we think the 131 level will hold as a resistance, and we will look to sell rallies under it, towards the monthly SMA200 around128. Should the 131 level not hold and be broken up, we will wait for a retest to enter long towards 134.
EJ DAILY CHART.
 (No Ratings Yet)
Add your review