
TABLE OF CONTENTS:
Buy signal around 1,108 towards 1,12. Sell signals from 1,12 to 1,145 towards 1,0825. Buy dips above 1,1425
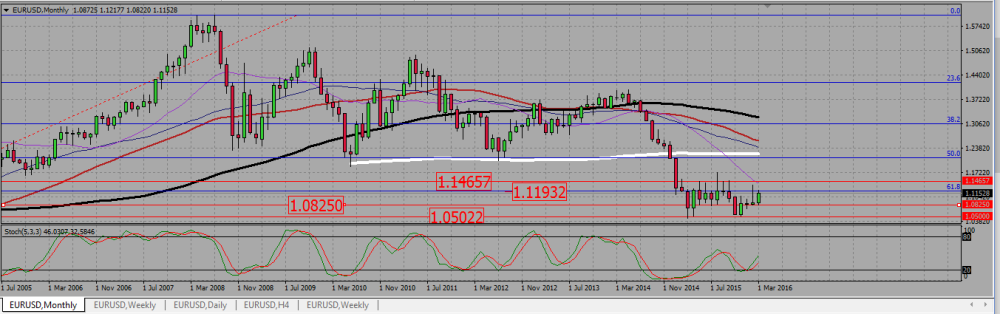
On the monthly chart, the euro is still ranging and is approaching the resistance of a monthly range, an area between 1,12 and 1,145. That range has two supports : one is located at 1,0825, and the other around 1,05.
EURUSD MONTHLY CHART.
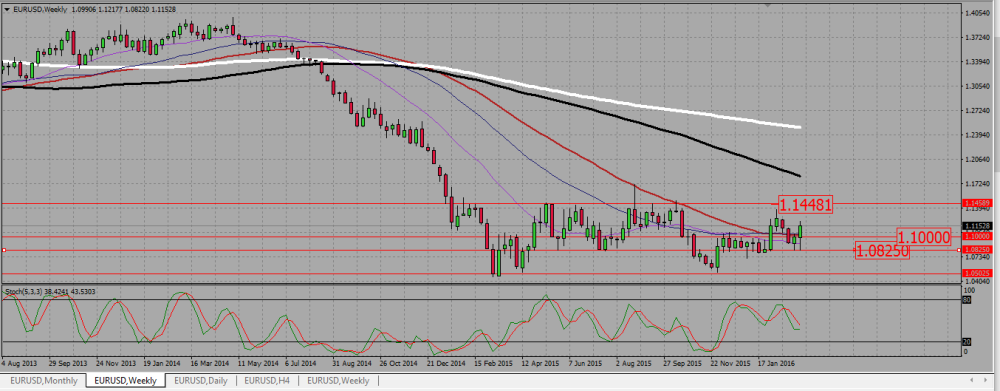
On the weekly chart, we see the two last candles rejecting that 1,0825 support line, with a double bottom and a bullish engulfing candle. This is a very bullish situation, except there is no trend in the pair for the moment, which makes me doubt whether the euro will be strong enough to push through the resistance of the monthly range.
EURUSD WEEKLY CHART.
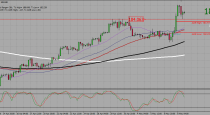
The situation is very mixed on the daily chart ; the SMAs are everywhere, and even the chart shows the pair ranging. Following the ECB announcement on Thursday, the euro climbed up 400 pips in one day, and broke up a minor resistance around 1,108. It then started to retest it as a support on Friday. I may give a try and buy a strong signal at that level, but I will do it cautiously as the pair is ranging and we are close to a resistance; my take profit level will be 1,12, and I will need to check my risk to reward ratio is worth a trade.
EURUSD DAILY CHART.

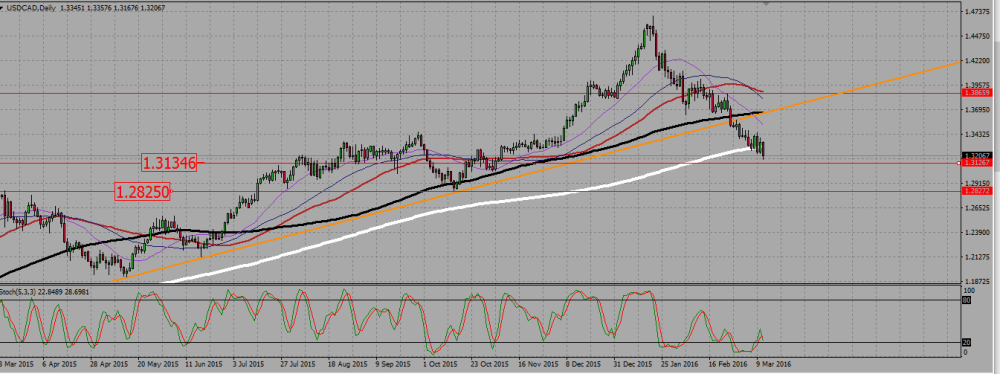
The loonie is crushing down through a support down. Under 1,31, sell signals towards 1,28. The pair may still turn bullish, but take only very strong signals as the bears are now in control of the market.
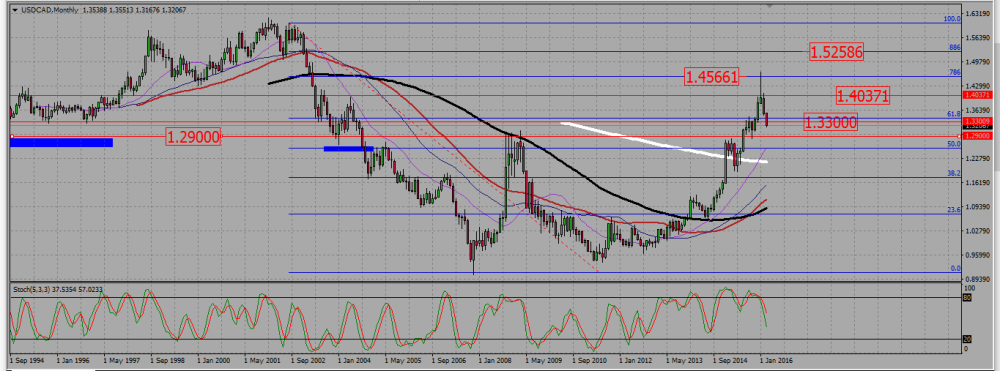
On the monthly chart, we see the pair going through a support zone around 1,33. The next support is located around 1,28. SMAs are rather indicating an uptrend, therefore and on the monthly chart the pair is consolidating down.
USDCAD MONTHLY CHART.
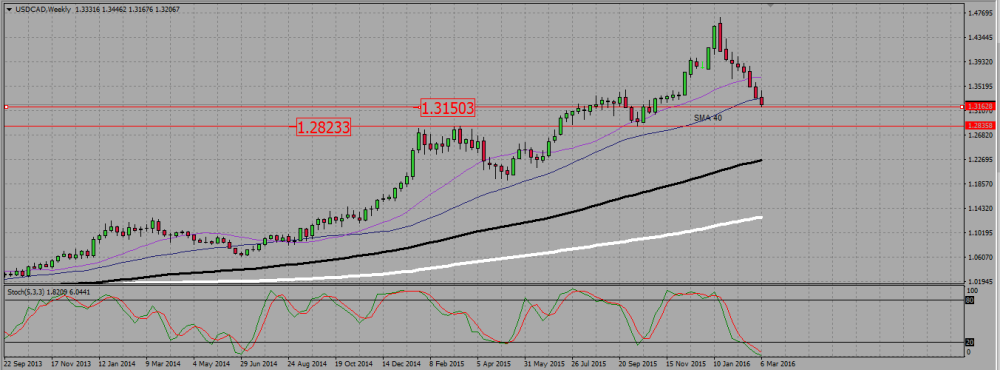
The SMAs on the weekly chart are still parallel and pointing up, which means the pair is in an uptrend. It is however strongly consolidating down, with no sign that consolidation wants to stop. The pair is just above a support around 1,315. If ti gives through, the next one is around 1,2825.
USDCAD WEEKLY CHART.
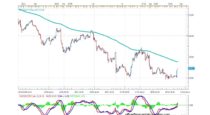
On the daily chart, shorter terms SMAs are already pointing down. The find here the two supports we identified on the weekly chart, one around 1,315 -1,3125, the second around 1,2825. The pair just broke down, retested, and confirmed the breakdown of the 200 SMA, currently around 1,33. I will sell any signals at that level on a new retest.
USDCAD DAILY CHART.
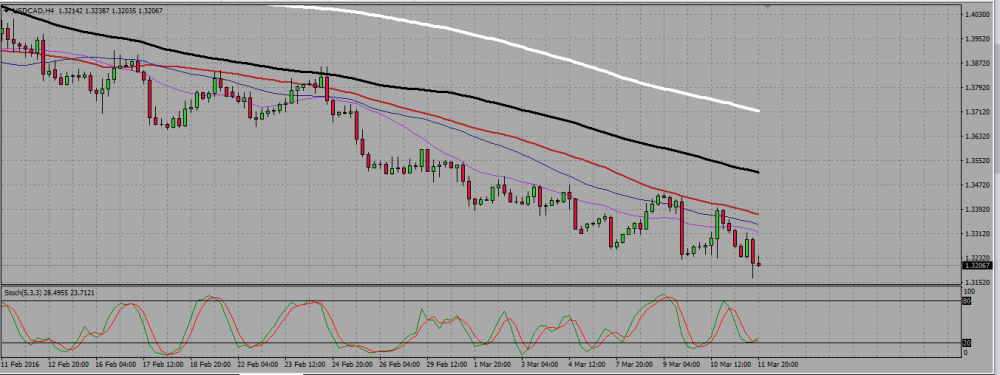
Finally, the H4 shows a perfect downtrend, with all SMAs parallel and pointing down. The bearish candles on that chart are obviously stronger than the bullish ones, meaning the bears are still in control. This is why even if a bullish reversal at that level is still possible, I will need a strong proof the bulls have taking back the reins to get into a long trade.
USDCAD H4 CHART.
Watch price action around 0,76 to go back to 0,735 or to keep rising towards 0,7875.
On the monthly chart the pair seems to be rejecting a 0,786 Fibonacci support line, and it has returned to a strong resistance at 0,76
AUDUSD MONTHLY CHART.
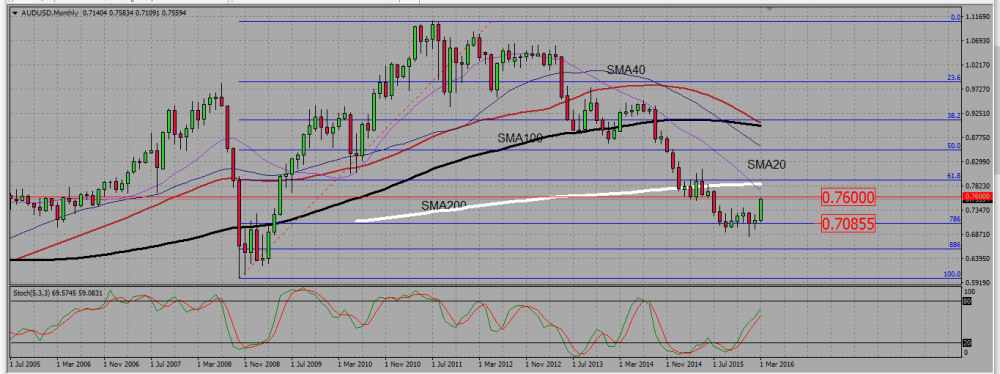
On the weekly chart, the pair completed an inverted head and shoulders, breaking up a resistance level around 0,735, which stand now as asupport and will be my take profit level should I enter short on the rejection of the 0,76 resistance. If the pair breaks up 0,76, the next resistance level is around 0,7875, and that will be my take profit level if I enter long on a confirmed break out of 0,76.
AUDUSD WEEKLY CHART.

 (1 votes, average: 5.00 out of 5)
Add your review