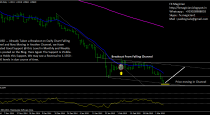
The EURUSD is still in a monthyl range. On shorter term charts it is trying to rise, but it ended the week just under a resistance zone, between 1,0975 and 1,105. If it breaks through, the next resistances will be around 1,12 and then 1,145. If it rejects that resistance zone, it should go back to retest a support line around 1,085, ad then a monthly range support around 1,05.
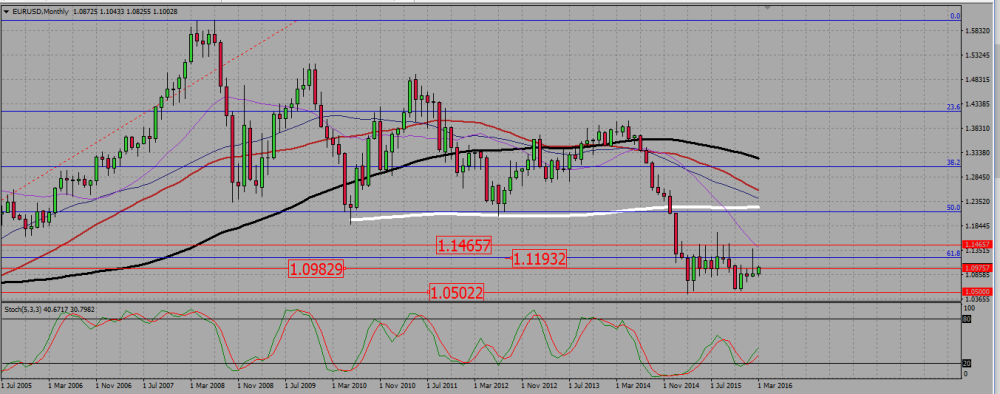
The euro is still in a range on the monthly chart, with a support at 1,05 and resistance around 1,12 -or 1,145-. Last month candle is a pin bar, nearly a gravestone doji, strongly rejecting the 1,12 resistance, but we started this month with a bullish move that brought the pair straight back into an inner resistance around 1,0975 -1,1. The 200 SMA is rather rising, but all others SMAs are pointing down, like in a downtrend.
EURUSD MONTHLY CHART.
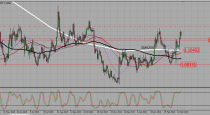
On the weekly chart, long term SMAs, -200 and 100- are pointing down, while shorter terms SMAs are mixed. The last candle is a bullish pin bar ( What is PinBar? ), rising from a support around 1,085, and the pair is now struggling with the resistance we noticed on the monthly chart around 1,10. The 55 SMA, that seems to be a good support/resistance for that pair, is also located just above, around 1,105.
EURUSD WEEKLY CHART.

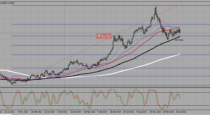
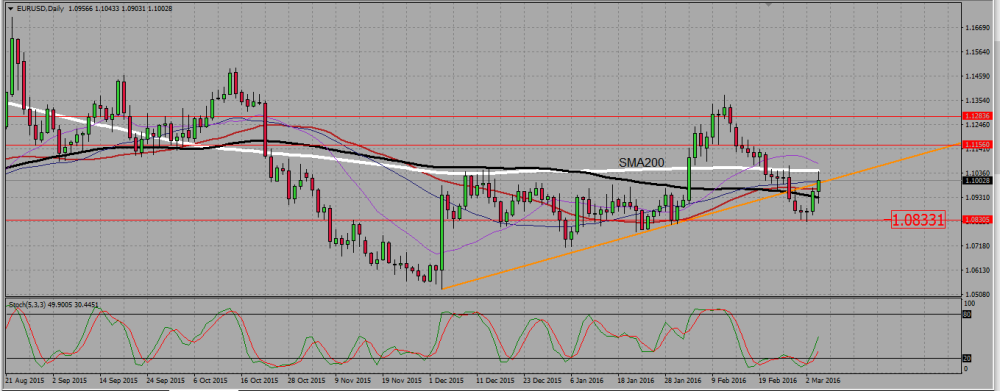
The daily chart shows us a bullish move trying to take place (a higher high, a higher low), but the pair also broke down a rising trend line, and is now retesting it as a resistance at 1,098. The SMAs are really mixed, but the 200 daily SMA seems to be a good support/resistance on that chart; it stands now as a a resistance around 1,105 and may be used to look for long or short signals.
EURUSD DAILY CHART.
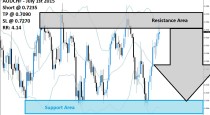
On the daily chart, we see the pair crushing down. That bearish move is very strong, and there are very little down wicks on the candles, meaning the bulls are totally defeated, not even trying to fight back at the moment. But as we are in a strong supporrt zone, I see two supports I will monitor closely, namely the 200 SMA around 1,3275 and a 0,786 Fibonacci support around 1,3225. As we see the bears being in total control of that market, I need a very strong reversal signal here -something like a clear hammer or a strong bullish engulfing candle- to enter long.
 (2 votes, average: 5.00 out of 5)