Look for selling signals on the resistance of a monthly range between 1,13 and 1,145,aiming at 1,12. You may try to buy a good signal at 1,12.
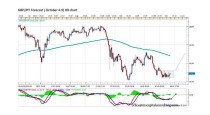
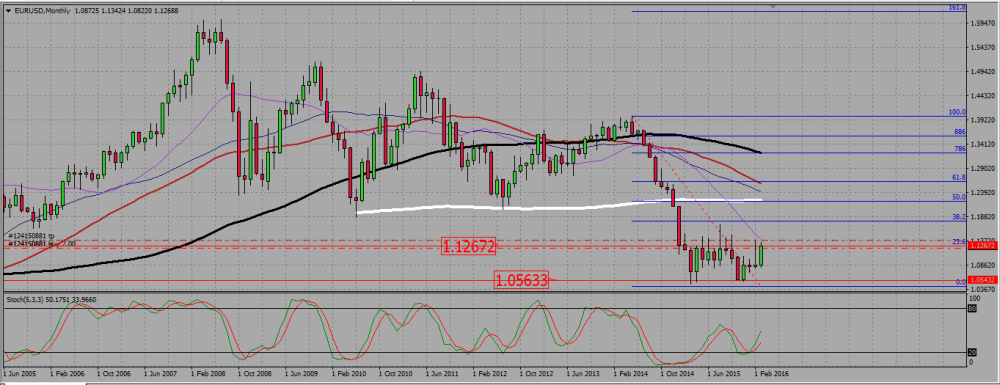
The monthly chart shows the pair ranging and getting close to its range resistance around 1,126, where a 23,6 Fibonacci level is located. This range (roughly 1,05 – 1,13) has been going on for one year now.
EURUSD MONTHLY CHART.
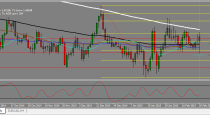
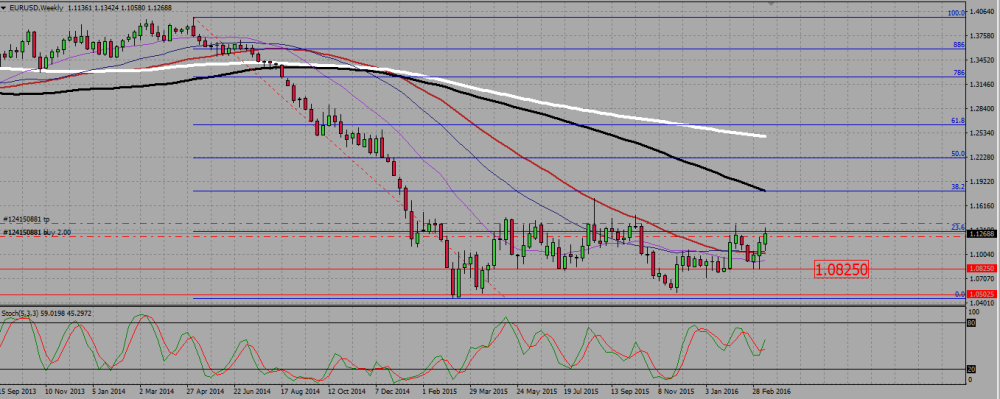
The weekly chart shows the pair bouncing up after rejecting a strong support located at 1,0825. It then broke up 1,12 and is now facing the 23,6 monthly Fibonacci level around 1,126.
EURUSD WEEKLY CHART.
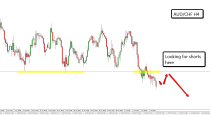
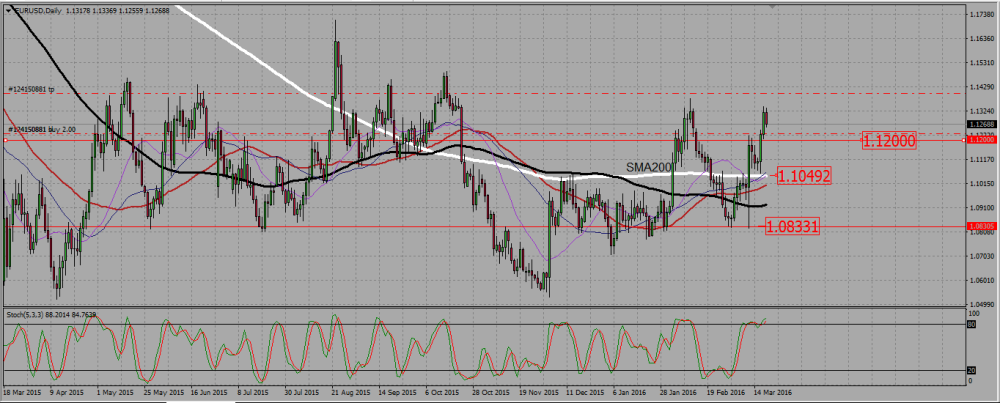
There is no clear trend on the daily chart, but after starting the week consolidating down, the pair strongly rejected the 200 SMA support around 1,105. It then surged up by more than 200 pips, broke up the 1,12 level, and seems willing to retest it. I will buy any good signal around 1,12.
EURUSD DAILY CHART.
 (1 votes, average: 5.00 out of 5)