
Basics of “Trend Line BreakOut Trading”
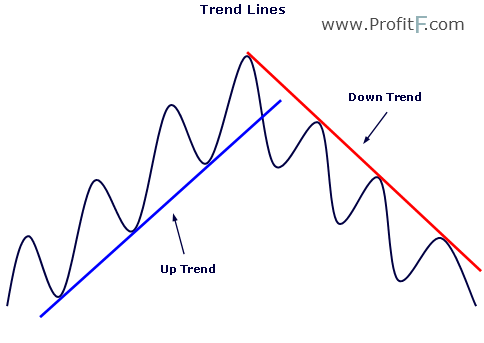
Trend lines are sloping lines that are drawn connecting consecutive highs or lows to plot the up trends and down trends. Trend lines are simple and easy to draw yet are powerful when combined with different trading strategies. The trend lines can be plotted for any markets and in any time frames and make for a reliable way to trade. Trend lines are a form of support and resistance albeit are sloping unlike traditional support and resistance levels which are horizontal levels.
When a trend line is plotted connecting the highs the slope is downwards, indicating a downtrend and when a trend line is plotted connecting the lows, the trend line slopes upwards, indicating an uptrend. Trend lines can be used on the OHLC bar chart, candlestick charts and even the closing line charts.
The chart below shows an example trend line that was drawn connecting the consecutive highs, thus forming a downtrend or a slanting resistance line.

The example below is that of an uptrend line that was plotted by connecting consecutive lows, forming an uptrend and in a way a slanting support line.
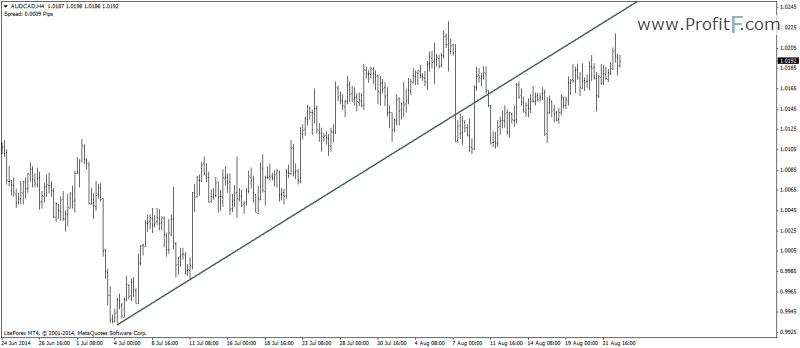
The below chart shows the trend line plotted on an OHLC bar chart.
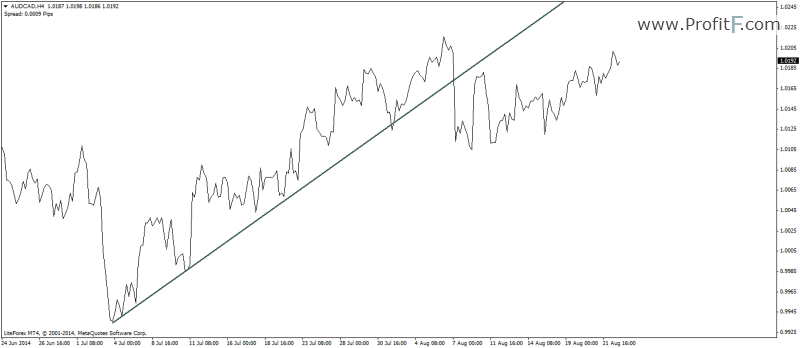
And finally, the trend line plotted on a closing line chart.
Depending on your chart preference, trend lines can be used accordingly.
Notes on trend lines with closing line chart
When plotting trend lines on a closing line chart, the major difference to other chart types is that trend lines are plotted on the closing lows. It is usually the most technically correct way of plotting the trend lines are closing prices are important price levels as compared to highs and lows, which are price rejections.
What are Trend lines used for?
Trend lines are used as a way to understand the strength of a trend. The most ideal trend lines are ones that have a smooth slope at an angle of 45°. A trend line is said be valid when there are at least three highs or lows that have contact with the trend line but a minimum of two contacts are required for a trend line to be plotted. Trend lines are nothing but dynamic support and resistance levels and are traded in the same ways as horizontal support and resistance levels are traded.
Trend Lines trading strategies
Trend lines, themselves can be used for trading. The two most popular ways to trade trend lines are:
Besides the above two trend line trading methods, there are many other trading strategies that are built up on the concept of trend lines. Some of them are:
Buying/Selling with Trend Lines
One of the simplest ways to trade with trend lines, this method involved buying or selling when new price retraces back to the trend line. The first step is in choosing a time frame of your choice. Typically, t is better to start with a higher time frame and then narrow down to the time frame of your choice.
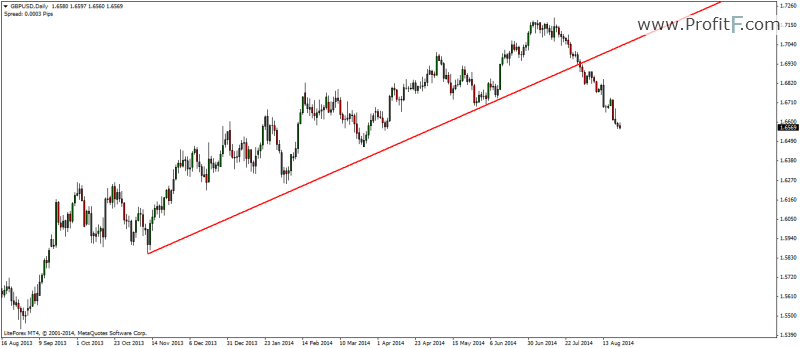
Below is the daily chart of GBPUSD where an uptrend line was plotted after identifying points (or lows) 1 and 2.
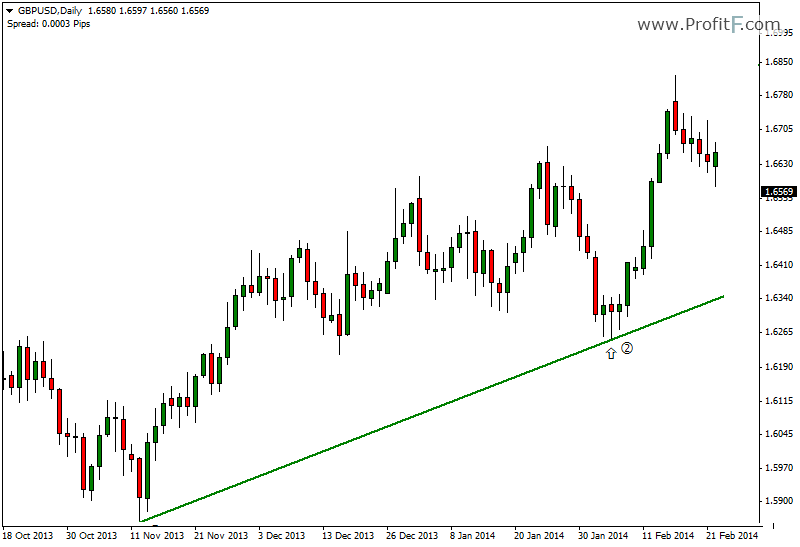
This chart is simple yet very effective. The idea is to buy when price retraces back to the trend line to resume the uptrend.
Notice as price action unfolds we see a contact/bounce from the trend line at point 3.
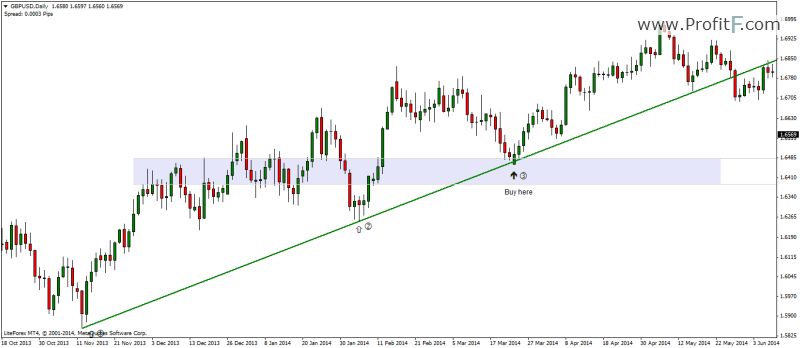
The retracement forms a confluence of past horizontal support levels as well as the trend line, thus providing a very safe opportunity to buy the dip in this up trend.
The above simple trading strategy can be combined with either price action trading or using oscillators to further enhance the trade signals.
Trading the Trend Line breakout method
This method is basically a continuation of the previous method, but traders wait for the trend line to be broken in order to follow the price action. When a trend line is broken, price often goes back to retest the trend line and these retests of the trend line offer a safe entry into the trade.
Note that a break of the trend line does not infer that the trend has changed. There are many instances where price breaks the trend line, only to go back above (or below) the trend line to resume the previous trend.

The above chart shows how the trend line break method is used. Here we first notice a downtrend in play as we connect the consecutive highs. Price breaks the trend line after the third contact, rallies above the trend line, retraces back close to the trend line and resumes its uptrend. Within this concept there are many trading strategies that can be developed.
Conclusion
To summarize trend lines in trading, they are one of the simplest and easiest ways to determine the trends in the market. Trend lines are applicable in any chart time frame and can be applied to any chart types (OHLC, Candlesticks, Line). Trend lines, when used in conjunction with horizontal support and resistance levels can form a very objective way to trade with price action and they can also be combined with oscillators to identify potential trade opportunities.

 (11 votes, average: 4.36 out of 5)


Add your review