
Download Inside Bar indicator for MT4
Inside bar Price Action pattern is one of the familiar candlestick patterns and one which is looked up with interest. An inside bar is formed when price trades within the high and low range of the previous day, making the candle an inside day or an inside bar. The inside bar is therefore a two candlestick price pattern. An inside bar is also similar to a bullish or a bearish harami candlestick pattern. The main difference being that with an inside bar, the highs and lows are considered while the real body is ignored.
In this article, we explain the following in relation to the inside bar:
What is an Inside Bar?

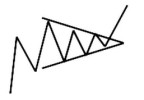
An inside bar is generally considered to be a reversal pattern formed when the second bar or candlestick is engulfed within the previous bar or candlestick’s high and low. The following image in figure 1 shows examples of inside bars. The inside bars are best identified using a bar chart, but a regular candlestick chart can also be used to identify these price patterns. We can notice that when an inside bar is formed; the following candles are usually extremely bullish or bearish.
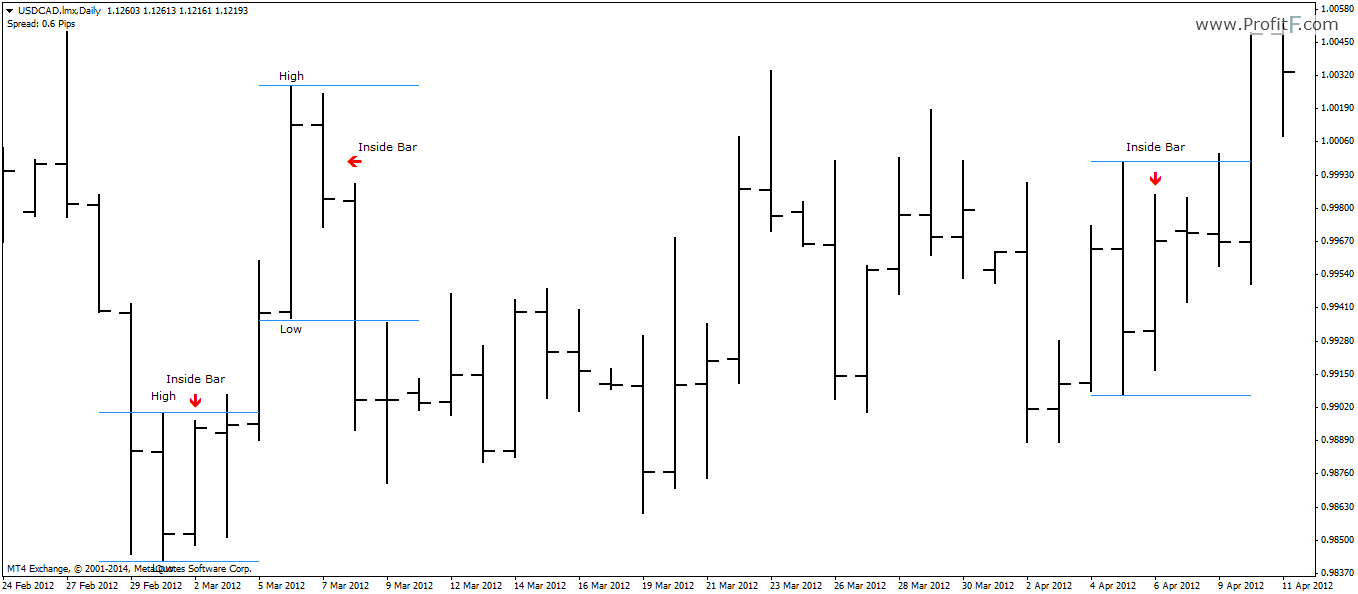
Figure 1: Inside Bar Examples
Why are inside bars formed?
Inside bar price action Pattern are formed when price or market sentiment is extremely positioned in one direction. For example, most valid inside bars are those that are formed when the preceding price bars show extreme bullish or bearish sentiment. Although an inside bar is usually referred to as a reversal candlestick pattern, they can also exhibit a continuation pattern as well. An inside bar basically tells us that buyers and sellers have been reluctant to push prices above or below the previous candle’s high or low. In a way, inside bars reflect indecision in the markets.
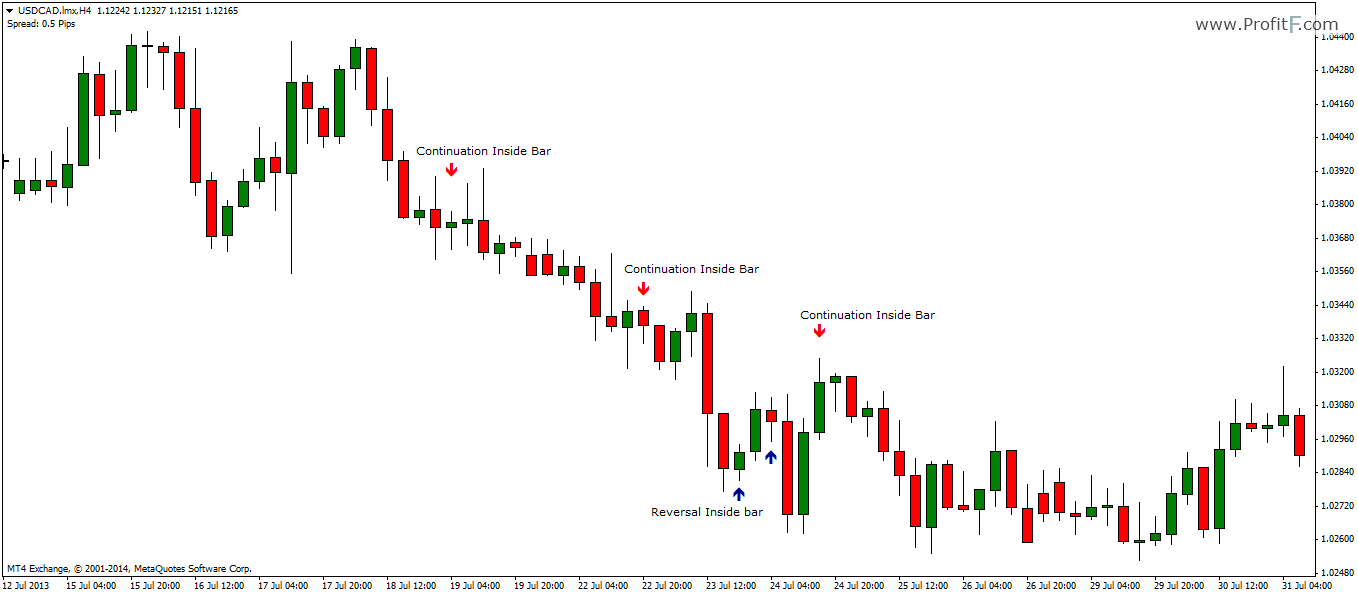
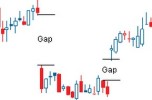
Figure 2: Inside Bars (Continuation & Reversal)
The above chart in Figure 2 shows how the inside bars are formed, which happen to be continuation as well as short term reversal patterns. From the above example, we can therefore understand that an inside bar needs to be traded not in isolation but within the larger concept of the trend and price action. ( ? What is Price Action trading?)
Inside bars can be very compatible when trading with channels such as envelopes, Bollinger bands, Keltner channels or Donchian channels.
How to trade the inside bars?
When trading with Inside bar price action pattern, the important point to bear in mind is that they often come ahead of an important price move. If you look back on the charts shared above, you will notice that right after the inside bars are printed on the chart, the following price action has always been within an extreme sentiment. Inside bars therefore can be explained as being somewhat similar to congestion before a break out.
In figure 3, when we apply the default Bollinger bands, we can notice that the bands first contract, showing a period of congestion while also telling us of a potential explosive price action soon to come. This is further validated by the formation of an inside bar just before a big rally explodes as the Bollinger bands start to expand indicating volatility.
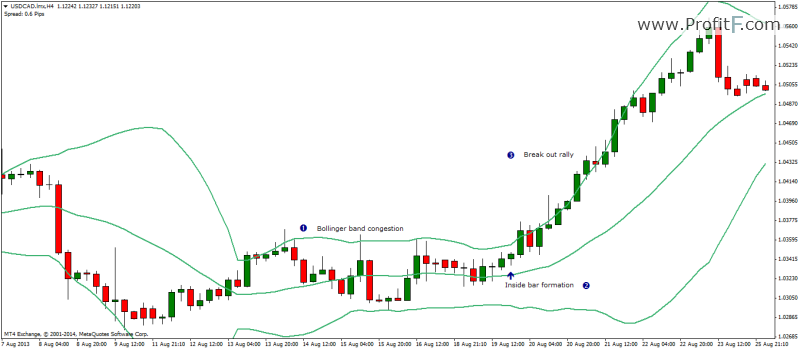
Figure 3: Inside bar break out of Bollinger band congestion
The following figure 4 shows another example of the inside bar being identified ahead of a break out from a congestion zone where price was literally trading within a range. The inside bar is further validated by a doji candlestick pattern, just a few candles ago and right near the upper end of the congestion zone.
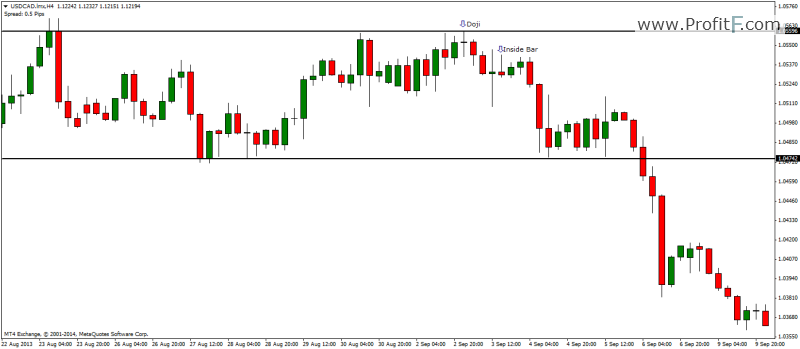
Figure 4: Inside bar break out from congestion zone
From the above examples, we can see how the inside bars can be a good candlestick pattern set up that warns us of a potential volatile price action. While most texts talk about inside bars as reversal candlestick patterns, the truth is that inside bars can act as both continuation as well as reversal patterns. What determines it as a continuation or reversal pattern is dictated by the overall trend and the larger context.
As with any candlestick price action trading, inside bars should be identified and used within an existing trading system or when they are formed near support and resistance levels. Because the inside bars are validated by two candles, they are more robust than considering single candlestick patterns. Another common myth is in placing a stop loss orders just near the high of the previous candle of the inside bar. While it is easy to explain this in hindsight, when the market is unfolding in real time, factors such as spreads and volatility can easily take out the stop loss levels, this is referred to as stop hunting in trading terminology.

 (36 votes, average: 4.39 out of 5)

Add your review