TABLE OF CONTENTS:
Price action trading (PAT) is a form of technical analysis which invokes awe and confusion at the same time. If you have been around trading forums a lot, you might have come across a few traders boasting of how they trade purely with price action. Price action trading goes by many names, but the most commonly used phrase referring to price action is “naked trading” or “trading naked”.
So what is price action and why is this form of analysis always looked up to? Read this article further to understand what price action is and how you too can trade with price action.
Price action trading is a form of technical analysis devoid of any technical indicators. Price action analysis is built upon the tenet that price reflects everything and therefore price is considered to be the, and only indicator that traders need. In price action trading, price is of utmost importance to the trader/analyst. It is a study of price in relation to the past price (or price history). Therefore, price action is nothing but a study of how price changes.
It is common knowledge that any technical indicator, be it moving averages, or oscillators such as Stochastics or RSI, all these indicators tend to use price as the base. For example, a simple moving average is constructed as an average of price over a specified period of time. Therefore, proponents of price action believe that it is better to use price as an indicator itself and trading with price directly rather than having to use any indicators.

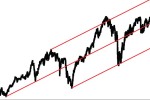
The chart above is typically reflective of how price action traders trade. As you will notice, there are no indicators on the chart, but rather some trend lines, support and resistance and so on.
What are the basic building blocks of price action trading? Price action trading is built upon the analysis of the following:
The candlestick approach of price action deals with a certain behavior of price depicted in the candlestick charts. Of course, at times the OHLC bar chart is also used. Although both the bar chart and candlestick charts tend to reflect the same sentiment, candlesticks are used as they are easy to recognize.
Some of the common price action candlestick patterns are:
There are many more candlestick patterns but the above are some of the important price action patterns that traders often look to and are also easy to identify with. Although the candlesticks come with different names, they basically reflect the market sentiment.
The example below shows a bearish engulfing candle. In other words, this two candle price action formation indicates that the sentiment in the market is bearish as price failed to make a higher close and the lower close was much lower than the previous open.

As you can see, the following price action trading after the bearish engulfing pattern saw a continued decline in the market. Trading can in fact be done by reading the price candles alone. The following example shows how a long position could be traded by simply looking at and understanding the price action that is unfolding.

We first spot a very bullish candle, which clearly engulfs the previous candles bearish price action. So a long position is initiated at the high of this candle. The next candle closes bullish but leaves a long upper wick, indicating some kind of rejection. The following two candles are lower, but the fact that they have long lower wicks is indicative that there are more buyers and then sellers. So the long position is kept open. After the two bearish candles, we see a series of bullish price action (with subsequent closes higher). It is after the appearance of the doji candle, is when the long position would be reduced.
This approach, as you can see requires a bit of skill and understanding of the markets and of course price action itself.
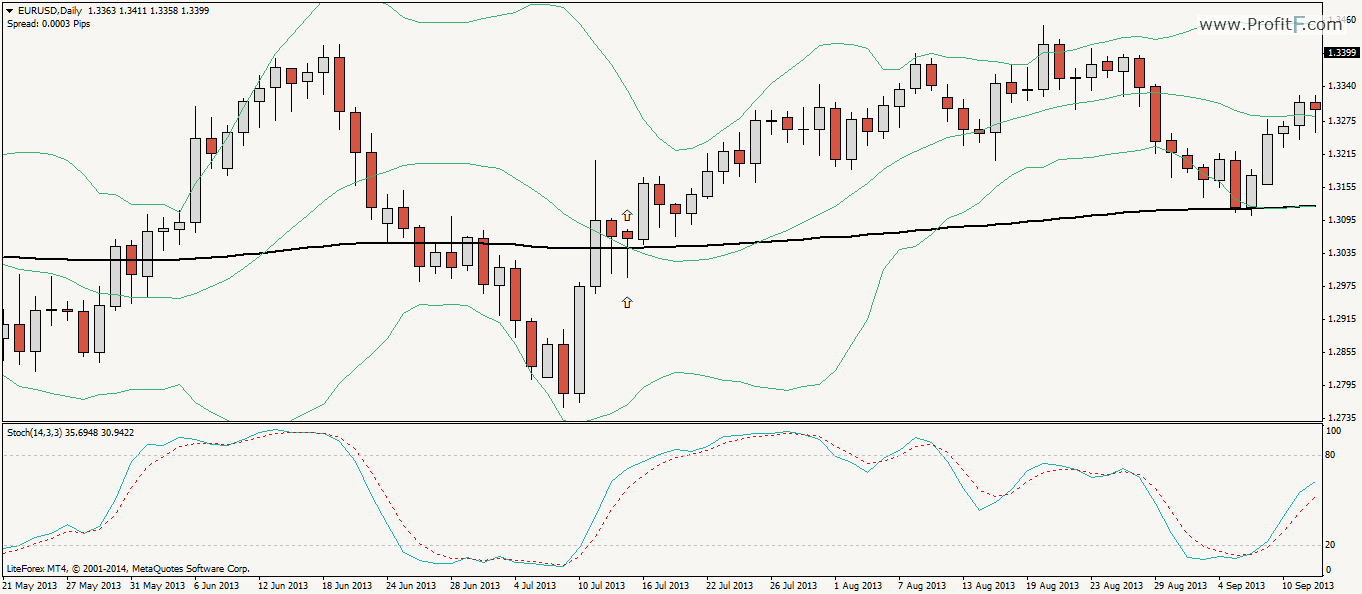
If we look to the same chart but with indicators, we can notice how the buy signal has been triggered a bit lately.
Besides analyzing the candlestick patterns in isolation, price action can be more effective when combined with support and resistance.
For example, a bullish engulfing candle near a key support level offers a great probability of taking a long position than having to trade merely off the candlestick pattern with no reference to past price. This is where support and resistance can help the traders.
If we look at the same chart as show above, but zoom out a bit, notice the region from where price made a bullish sentiment candle?
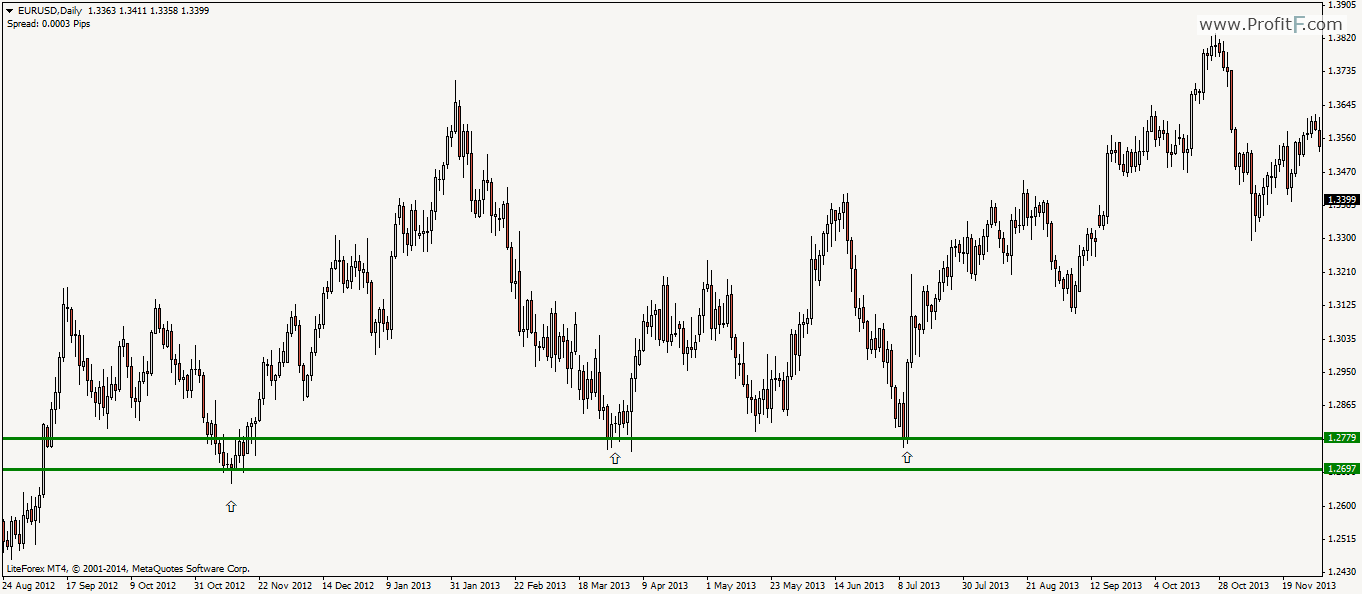
If we look to the left of the chart, that region was an important support level (or an area where there were more buyers in the past). Therefore to the price action trader, this was a no brainer trade. And it was a low risk/high probability trade as well. This is something that indicator based technical analysis wouldn’t be able to reflect as accurately as with price action.
Besides the support and resistance, price action trading can pretty much be applied to any trading system or markets. By reading the candlesticks, the market sentiment is expressed explicitly on the charts, thus allowing traders to understand the bias in the markets.
The following chart shows how price action trading can be applied to a moving average based trading system.
The rules of moving average states to buy when price is above its moving average and to sell when price is below its moving average. In the chart below, we notice how the moving average was broken, but after a minor drop, price rallied back. Without the understanding of support/resistance in this aspect, a trader would have had no clue on how to trade.
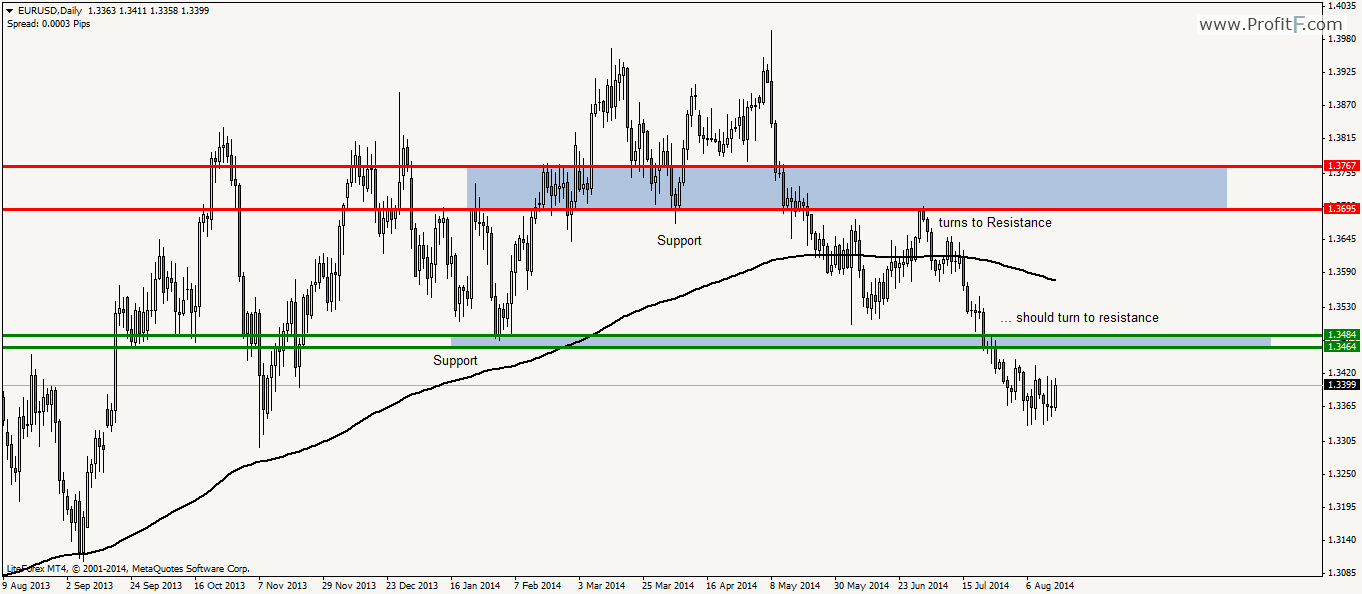
But look how the perspective changes when we have the support and resistance lines drawn on the chart. A bearish candle at the second retest is indicative that market sentiment will be bearish, which was reiterated by the following bearish candles that were formed.
Price Action Trading – A formidable way to trade the markets. As you can see from the above examples, price action trading requires a bit of questioning and understanding of the market sentiment. Unlike technical trading systems involving indicators, price action trading can be a smarter way to trade the markets. Of course, patience, skill and practice are essential, but once a trader gets accustomed to these, price action trading is probably the only thing they will need to trade the markets.
It can be practically applied to any trading strategy, from break outs, to moving average cross-overs to oscillators. While price action might seem a bit complicated at first, with due practice it can become second nature for the trader to trade with price action.

 (36 votes, average: 4.72 out of 5)