William D Gann is one of the most famous of technical analysts who has managed to capture the imagination of traders. One of the complex trading systems, the Gann methods involve both price and time and is aptly used for forecasting prices. W.D. Gann based most of his research on astrology and numbers and it is rumored that he made over $50 million during his trading career. Gann’s trading methods involve geometry within the price-time series.
Some of famous WD Gann trading tools are:
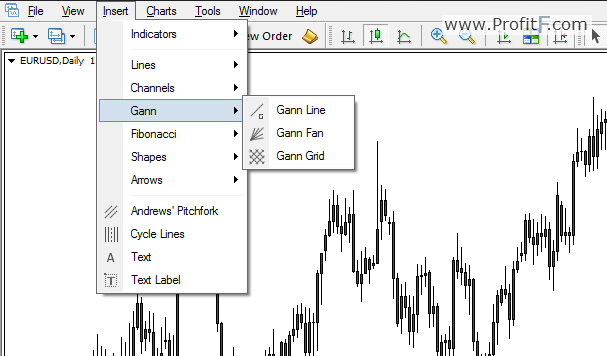
The Gann tools are usually a standard set of tools available with most default charting packages. In the MT4 platform, the Gann tools can be accessed from:
Insert > Gann Tools section of the menu bar
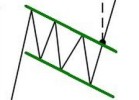
Most of Gann’s work rely on Geometry and it is now a well know tenet of W.D. Gann which states, that there was a perfect balance when price rises and falls at a 45 degree angle
Trading with the Gann Grid
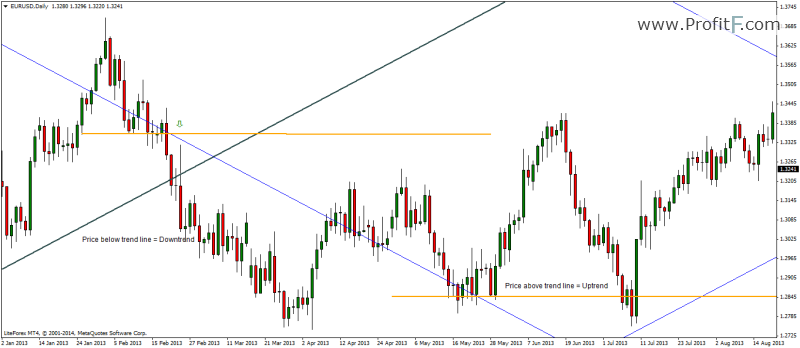
The Gann Grid is often considered to be a leading indicator as it projects trend lines into the future. The grid comprises of squaring time and price based on the 45 degree angle of the main trend line. When price is trading above the Gann trend line, the market is considered to be in an uptrend and when price trades below the Gann trend line, the market is considered to be in a downtrend. The Gann grid enables traders to decipher the strength of the trend and also predict change of trends.
To plot the Gann Grid, two consecutive highs or lows are connected (the same way as one would draw a trend line). The Gann Grid tool does the rest of the work and creates a grid.

The chart above shows the Gann grid, which is plotted, after connecting two consecutive lows at A and B. It is important to note here that each of the trend lines within the grid could be seen as a trend line. There is no hard and fast rule about connecting highs or lows. Because the market is never in perfect harmony, the Gann grid can be adjusted to suit the current price action.

The chart above shows the adjusted Gann grid. Notice the bold lines that have been highlighted. The Gann grid has been adjusted so that price is as close to the Gann grid lines as possible. This adjusted view of the Gann grid offers a much better view of the markets than simply connecting highs/lows.
Therefore, if we apply the theory of uptrend when price is above the trend line and vice versa, we can see some very interesting observations.
When we zoom into the chart, we can see how price reacts to the Gann grid lines.
Notice how the trends (or corrections) within the major uptrend are depicted using the Gann Grid tool which form support/resistance trend lines. On close observation the Gann grid can also be viewed as a channel. For traders who do not want to get into the detailed Gann trading methods, can merely stop here and use the Gann grid to trade the same was as trading trend lines or channel lines.

Gann states that when price trends along a Gann trend line, the trend is usually strong. The chart below shows how a trade would taken based on the Gann grids.
Trading with Gann Fans
The Gann Fan trend lines are another way to trade using the trend lines, with the option to buy sell on successful break of the trendlines.
The chart below shows how the Gann fans are formed by connecting two consecutive lows. The fan lines are automatically plotted.

In the simplest of illustrations we buy on the break and retest of the Gann trend line, marked on the chart. After a break and retest of the main trend line, a long position was taken, with stops at the previous low while targeting the most immediate trend line to the upside.
The Gann trend lines are projected into the future and thus depict future support/resistance levels.
Gann Trading Methods – A complex forecasting tool
The above methods illustrated in this article are merely scratching the surface of the Gann trading methods. In its entirety Gann’s methods are more applicable towards long term forecasting of prices. However, this method requires years if not decades of dedicated practice in order to master the techniques of W.D. Gann.

 (10 votes, average: 4.20 out of 5)