

Trading the Triangle Chart Pattern
Triangle chart patterns are one of the more commonly found chart patterns. They indicate a period of congestion, represented by falling resistance trend line or rising support trend line with a horizontal support or resistance lines. These triangle patterns are relatively easy to trade and can be formed across different chart time frames. The triangle patterns fall under the continuation patterns. Meaning that depending on where they occur within the trend, the triangle that is formed signals a continuation of the trend or can also be traded as a reversal pattern.
Triangles are mainly categorized into the following:
As with most chart patterns, triangles are also best identified with using a line chart as the patterns are easier to spot and trade. One of the important criteria to bear in mind when trading triangles is that there should be at least 4 points of reaction within the triangle. You can observe this in the illustrations in the rest of this article.
Ascending Triangle Pattern
The ascending triangle pattern is identified by a horizontal resistance line, with a rising support trend line. When this pattern occurs within a prevailing uptrend, it can signal a very reliable continuation of the uptrend.
The chart below illustrates the ascending triangle and the price targets.

Figure 1: Ascending Triangle Example
As we can see, the ascending triangle has a horizontal resistance line, with a rising support trend line. The trend line must be tested at least twice for the triangle to be valid. Measuring the distance from the lowest point to the horizontal resistance level, we obtain the price objective by projecting the distance on the break out of the ascending triangle. Stops are placed at the second trough (or low) formed just before the break out or at a more valid price level.
The following chart, Figure 2 illustrates the ascending triangle trade.
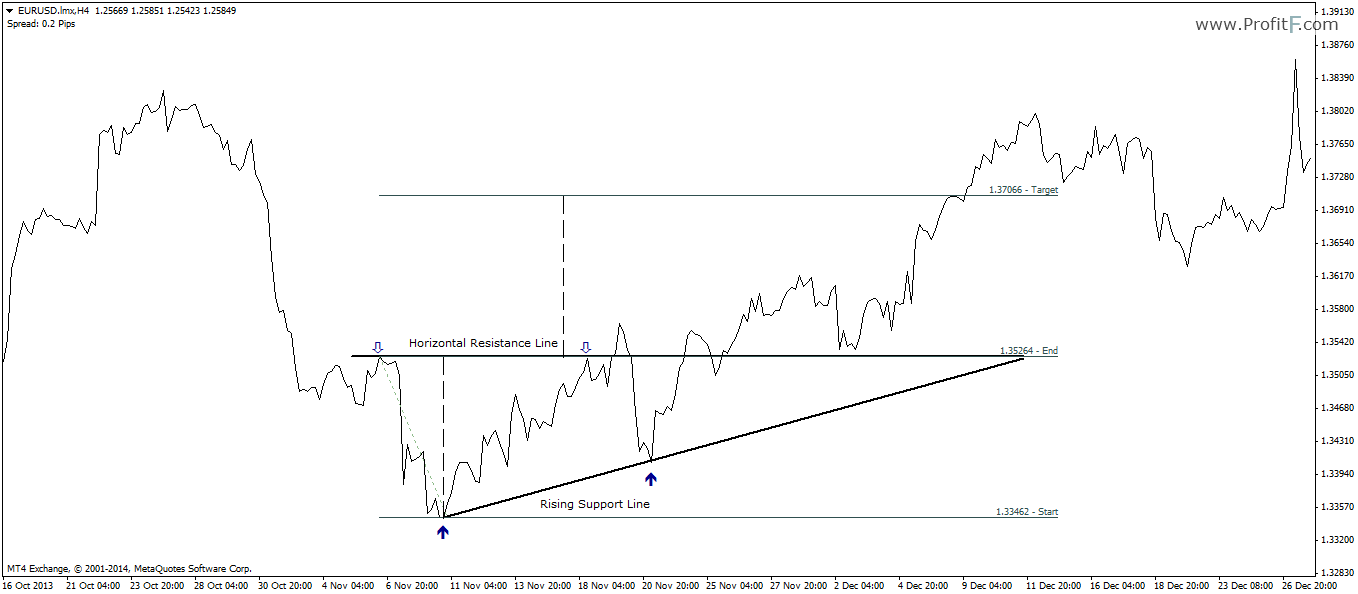
Figure 2: Ascending Triangle Trade Example
Descending Triangle Pattern
The descending triangle patterns indicate a move to the downside. The descending triangle is characterized by a horizontal support level followed by a falling resistance trend line. The price objectives are similar to that of the ascending triangle as shown in the chart below.

Figure 3: Descending Triangle Example
The following chart, figure 4 illustrates a trading example of the descending triangle.
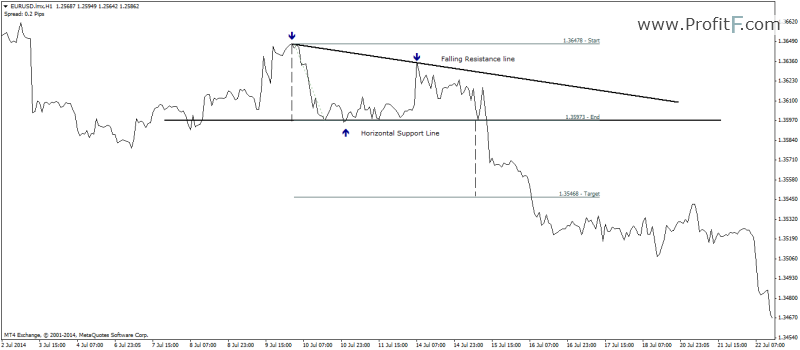
Figure 4: Descending Triangle trade example
Here, the descending triangle is identified by the falling resistance trend line but prices bouncing off a horizontal support level. After a break out of the support level, price drops in a sharp move to meet the minimum price objective.
Symmetrical Triangle Pattern
The symmetrical triangle patterns are characterized by both rising support trend line and a falling resistance trend line. This pattern indicates a period of congestion as price ranges within a tight sloping support and resistance lines and indicates an imminent breakout. Unlike ascending or descending triangle, symmetrical triangles can break out in any direction, which makes it a bit trickier to trade as this pattern is subject to fake outs.
The following chart, figure 5 describes the classic symmetrical triangle pattern.

Figure 5: Symmetrical Triangle Example
One way to qualify the symmetrical triangle’s potential break out direction is to look to the previous trend. If the symmetrical triangle forms with the previous trend being an uptrend, the chances of an upside breakout is much higher. Conversely, when a symmetrical triangle appears within a down trend, the chances of a break out to the downside are more valid. Having said that, there is no guarantee however on which way the price is likely to break out. The following charts illustrate symmetrical triangle trade examples.
In figure 6 below, we have a symmetrical triangle, identified with a falling resistance and a rising support trend line. Prices start to move within a tight range before the break out occurs. The price target is nothing but the measured distance of the first high and low of the triangle, projected from the break out of the symmetrical triangle.

Figure 6: Bearish Symmetrical Triangle Trade Example
The next chart below, in Figure 7 shows a bullish symmetrical triangle break out, which follows the same rules.

Symmetrical Triangles – Points to bear in mind
One of the important factors when trading symmetrical triangles are:

 (14 votes, average: 4.64 out of 5)

Add your review