Trading the Bullish and Bearish Rectangles Chart Patterns
The bullish and bearish rectangle chart patterns are identical in regards to the trading approach with the bullish and bearish flags. The main difference being that in the case of bullish and bearish rectangles, price consolidates tightly within an upper and lower bound horizontal range. When looked at in isolation, the rectangles simply represent a period of consolidation, which is very well known with breakout trading strategies. ( Read more about BreakOut Trading )
The added benefit of trading the bullish and bearish rectangles is that we determine the past price action to give us a bias. These patterns can be found in almost any chart time frame. Most noticeably, it is on H1 charts that the bullish and bearish rectangles are formed and can be more easily identified just after an important news release.
A bullish rectangle is often found when prices rally sharply and then enter a period of consolidation within a horizontal support and resistance level, after which a break out emerges to the upside. Likewise, a bearish rectangle is identified by a sharp decline in prices followed a consolidation within a tight horizontal support/resistance range and a break out to the downside.
In Figure 1, we have the bullish rectangle pattern example and the measured targets. As shown in the image, the pattern is somewhat similar to a bullish flag but with the consolidation confined to a horizontal short term support and resistance pattern.

Figure 1: Bullish Rectangle Chart Pattern Example
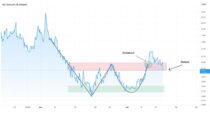
The following chart, Figure 2, shows an example of a typical bearish rectangle pattern. Here, the pattern is very similar to a bearish flag but with the horizontal support resistance acting as upper and lower bounds for price consolidation.

Figure 2: Bearish Rectangle Chart Pattern Example
The usual stops for trading these patterns are placed at either the upper or lower levels, depending on the type of rectangle that is being traded.
Figure 3 shows a trade example of a bullish rectangle pattern.

Figure 3: Bullish Rectangle Chart Pattern Trade Example
Here, we can see that after a sharp rally, to the left side, price started to move within a tight range for a considerable period of time. It then was followed by a break out to the upside, in the same direction of the previous price action before the consolidation period. Upon break out and retest of the upper horizontal resistance line, price then starts to rally higher and eventually reaches the same target as the projected distance prior to entering the consolidation.
The next chart, Figure 4 shows a trade example of a bearish rectangle pattern. Here, we find a sharp decline in prices followed by a period of consolidation within the rectangle.

Figure 4: Bearish Rectangle Chart Pattern Trade Example
In this case, we can notice that the consolidation was extended over a period of time, but eventually price broke out from the consolidation phase. A quick drop was followed by a retest close to the break out level and then prices declined to reach the projected distance.
In both the above cases, we can see that trading the bullish and bearish rectangles is quite simple. In fact, this approach can be applied to regular break outs as well. Instead of placing a buy and sell order on either ends of the support and resistance levels, if we scan back to the chart and see what the preceding price action was, (whether it was bullish or bearish), we can then take a position based on the previous price behavior. This not only reduces the odds of getting trapped with a fake out but also helps improves the odds.
Trading on a retest back to the break out zone is another good conservative approach to trading the rectangle patterns as it is a common occurance.

 (3 votes, average: 4.67 out of 5)