

Trading with Diamond Chart Patterns
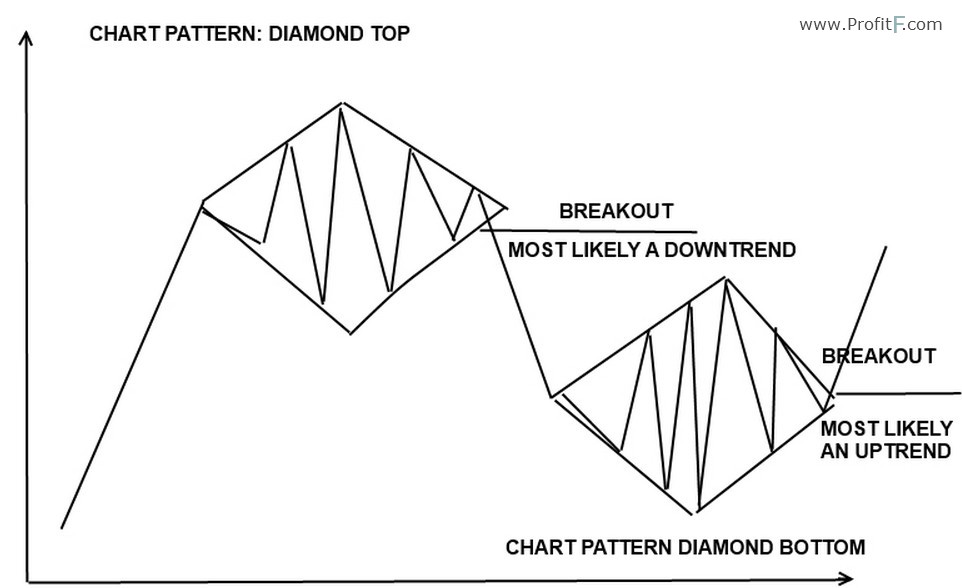
The diamond top and bottom are reversal patterns. It represents a rally to a new high with a drop to a support level followed by a rally to make a new high and a quick decline, breaking the support level to make a higher low. The bounce from the higher low is then followed by a rally, but making a lower high instead. Once this behavior is identified, prices then break the trend line connecting the first and second lows and start to decline further.
In the case of a diamond bottom, prices follow the same pattern, but instead make a new low and a new high followed by subsequent higher low and lower high. The diamond top and bottom patterns, despite its fancy name merely exhibits the trading sentiment and a period of congestion before a new trend emerges, depending on the chart time frame that you are using. The diamond patterns are infrequent and therefore relatively rare to spot them. However, the most ideal places to find the diamond patterns is within the head and shoulders patterns or within the triangle patterns. ( Read more about Triangle Chart Pattern)
Diamond Bottom pattern
Figure 1 represents a diamond bottom pattern. The diamond shape seen is nothing but the short term trend lines connecting the peaks and troughs within the price action.
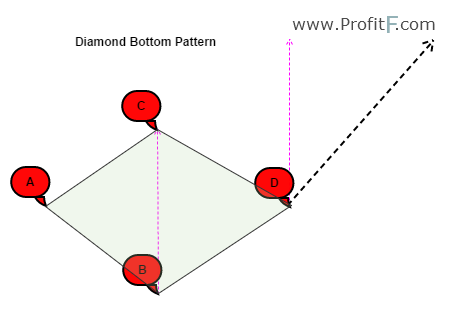
Figure 1: Diamond Bottom Pattern
When prices break out of the established trend lines, the pattern is said to be successful. The minimum price target is the measured distance between the points B and C, projected from the break out of D.
Diamond Top pattern
The following chart, Figure 2 shows an illustration of a diamond top pattern. It works on the exact same principles of a diamond bottom pattern but in the opposite direction.
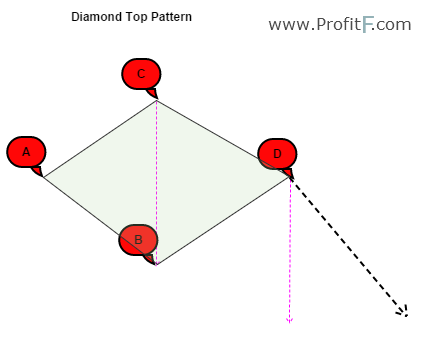
Figure 2: Diamond Top Pattern
One of the easiest ways to identify these patterns are that they are formed either at the top of the trend or at the bottom of the trend.
Examples
The following chart, Figure 3 shows a diamond top pattern being formed. Here, we can see the intermediary highs and lows formed and the subsequent lower highs and higher lows. After break out from the trend line, prices decline well enough to reach the intended target of the measured distance between the peak and trough of the diamond top formation.
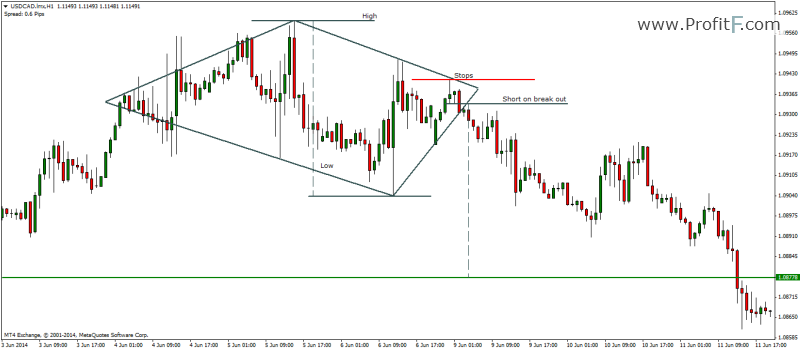
Figure 3: Diamond Top Formation
The next chart, figure 4, shows an example of a diamond bottom formation. Here, we can find how price formed the high and low and then traded within these peaks and troughs forming a diamond pattern and eventually breaking out of the congestion zone. The break out was followed by a rapid rally reaching the projected target from the break out level.
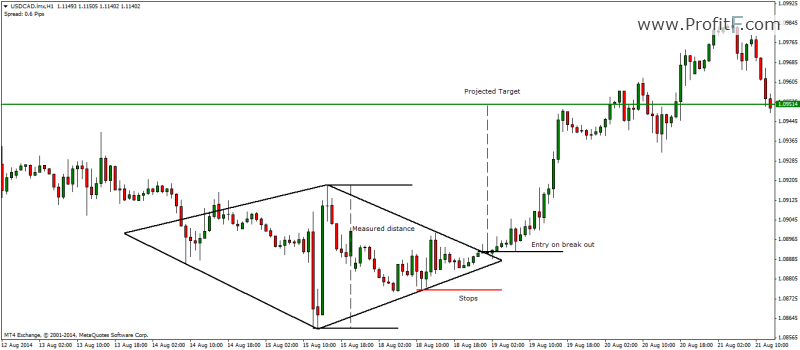
Figure 4: Diamond Bottom Trade Example
As can be seen by the above examples of diamond top and bottom patterns, these are very reliable chart patterns to trade. Another benefit is that they offer a very low risk compared to the potential rewards for the trade, making this a very good stand alone trading strategy in itself.
The only problem with diamond patterns is that they are rare to find and in real time trading, a diamond pattern is qualified only after the break out. We know that with break outs, sometimes prices rally or decline very quickly without any retracements or pullbacks, which is a factor to consider when trading the diamond patterns.
For beginners, new to chart patterns will find it a bit difficult to spot these patterns on the chart as it takes a while to train the eye to draw the trend line correctly. Another point of mention is that with more real time trading examples, you won’t find the perfect text book described diamond tops and bottoms, which can also make it tricky to trade these patterns.
However, with due practice spotting the diamond tops and bottoms should become easy once you are familiar with this pattern.

 (7 votes, average: 4.86 out of 5)


This is one of the most unpredictable chart pattterns, but one of the most profitable as well.