
Pin bars are a type of single candlestick patterns, which, when appearing on the candlestick chart, offers distinctive clues into the Price Action ( ? What is PA?) that is unfolding. Pin bars are not to be traded in isolation, but need to be considered within the larger context of the chart analysis. The benefits of trading with the pin bar candlestick pattern therefore makes it best suited to improve an existing trading strategy. In order to use the pin bar candlestick patterns, it is best to understand the following:
What is a PinBar pattern?
A pin bar is an individual candlestick pattern and is identified by its long wick and small bodies. Typically, the wicks of the pinbar should be longer than the body. The chart below shows some different variations of the pin bar candlestick patterns.
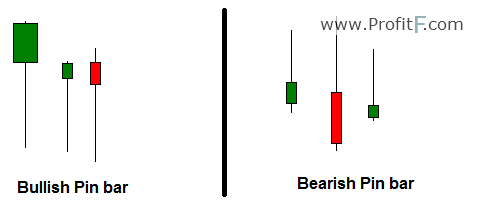
Figure 1: Pin bar examples
Identifying a Pin Bar candlestick pattern
Pin bar pattern is characterized by a long upper or lower wick with a small body relative to the size of the wick with little to no lower or upper shadows.
Other candlestick patterns that also qualify as a pin bar are hammer and inverted hammer and hanging man type of candlestick patterns. In some cases, a doji candlestick pattern can also qualify for a pin bar candlestick pattern.
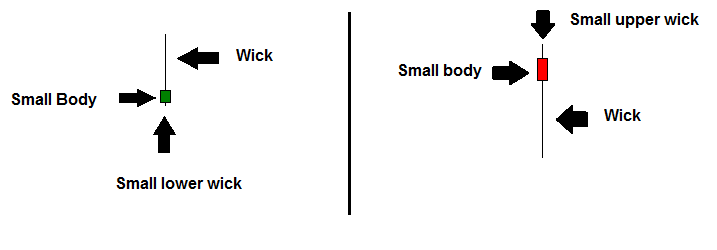
Figure 2: Identifying pin bars
The most important thing about the pin bars is that the color of the candle is not considered. Therefore, a bullish pin bar is identified by long lower wicks and a bearish pin bar is identified by long upper wicks, irrespective of how the body of the candlestick closes. Having said that, pin bars can have more validity when the body of the candle also corresponds to the over bias of the pin bar. For example, bullish pin bar with a bullish close is more valid and likewise, a bearish pin bar with a bearish candlestick is more valid.
Why are pin bars formed?
Pin bar pattern are formed when prices are tested and rejected, which is visually depicted by the long wicks the pin bar leaves. While pin bars can form anywhere on the chart, they are considered a strong pattern when pin bars are formed near support and resistance levels. Pin bars can also be commonly formed near a moving average as well as trend lines. Pin bars are valid across all time frames, but of course, a pin bar on a weekly or daily charts take more precedence than pin bars formed on lower time frames.
How to trade the pin bars
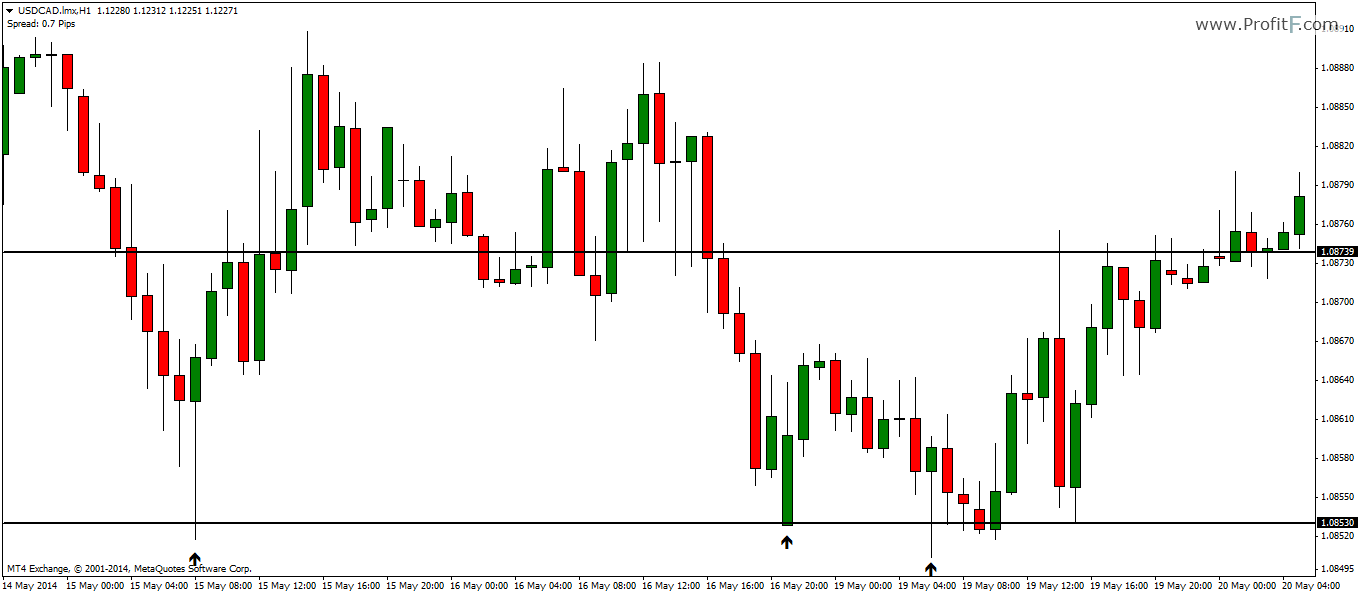
Figure 3: Bullish Pin bars at support
The chart above shows a pin bar rejection near a previously known support level. Notice how price constantly bounces off the support level subsequently. The identification of the pin bar at the support level shows that it is a strong level of buyers reflected by the long wicks. In this case, the pin bar is even more valid as the bullish pin bar also has a bullish close (twice). If you were to trade based off support and resistance, the appearance of the pin bar is reason enough to take long positions when price revisits the previously rejected price near the support zone.
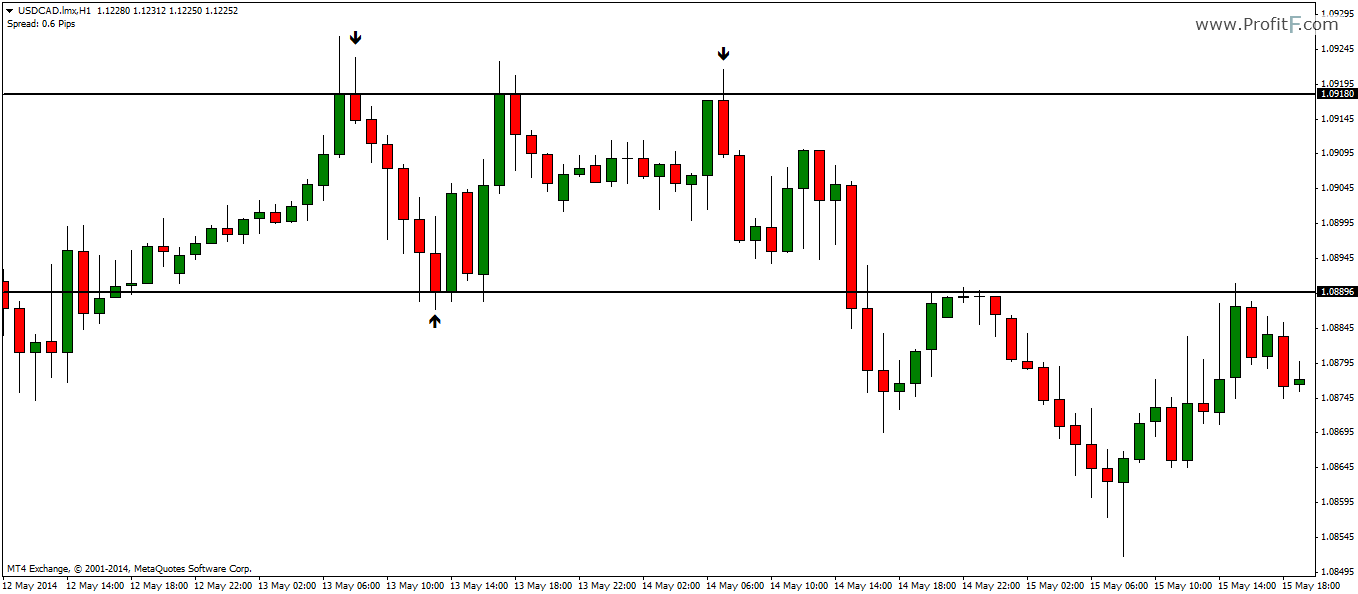
Figure 4: Bearish Pin bar at resistance
In the next chart above, we get to see an example of a bearish pin bar. Again, it is more valid because the body of the pin bar is also in the same bearish bias as well. A second test of the resistance level after the first pin bar was formed held and a third attempt was made which formed in a weaker form of the pin bar and prices subsequently dropped lower.
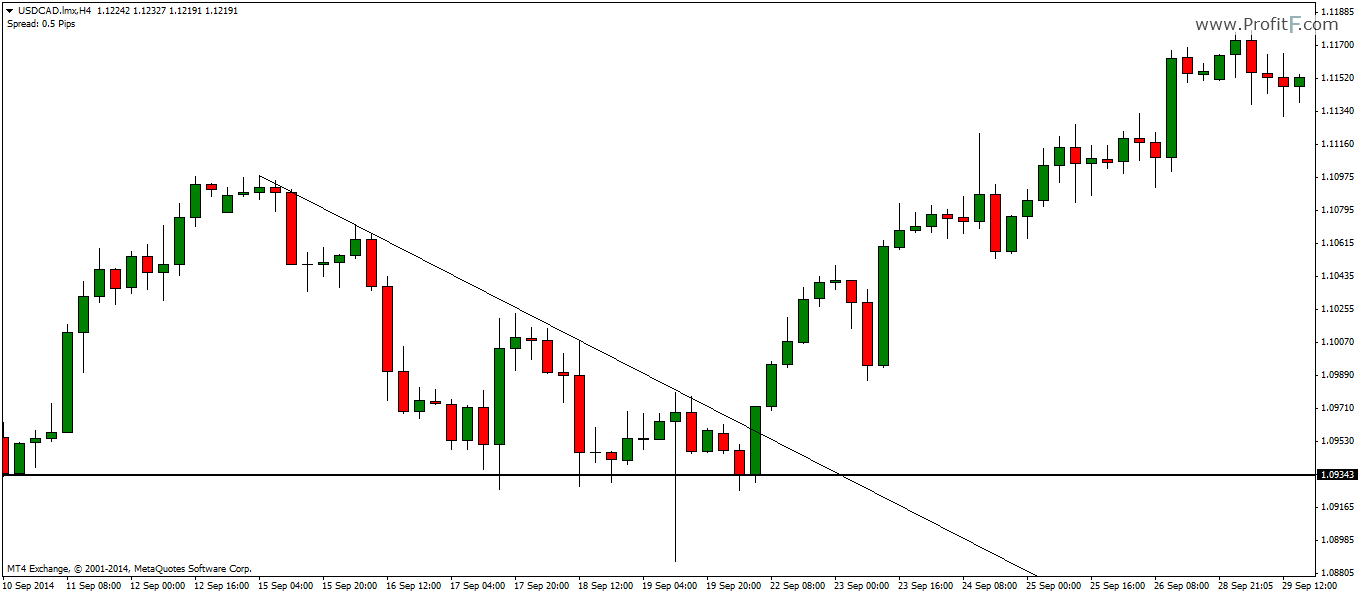
Figure 5: pin bar pattern with trend lines
In Figure 5, we have an example of trading trend lines with pin bar confirmation. Here, we first plotted a down sloping falling resistance line connecting the first two lows. As price continues to fall further with the trend line acting as resistance, towards the end, we notice a strong bullish pin bar. This tells us that while prices were pushed lower, the buyers out numbered the sellers, leaving a long lower wick. Eventually, a few candles later, price broke out of the falling trend line to rally.
As can be seen with the above examples, pin bars can be very useful in expressing the market sentiment. Although they are powerful candlestick patterns, they are not ideal for trading in isolation. There are many instances where despite the appearance of a pin bar, prices continue to break the previous levels that were rejected.
In figure 6, we can see an illustration of how a pin bar formation failed at support level. When viewed in isolation, the pin bar might have looked valid; however, when we consider the bigger picture where price was making lower highs previously, we can already see that the prevailing trend was down and thus question the validity of the bullish pin bar.
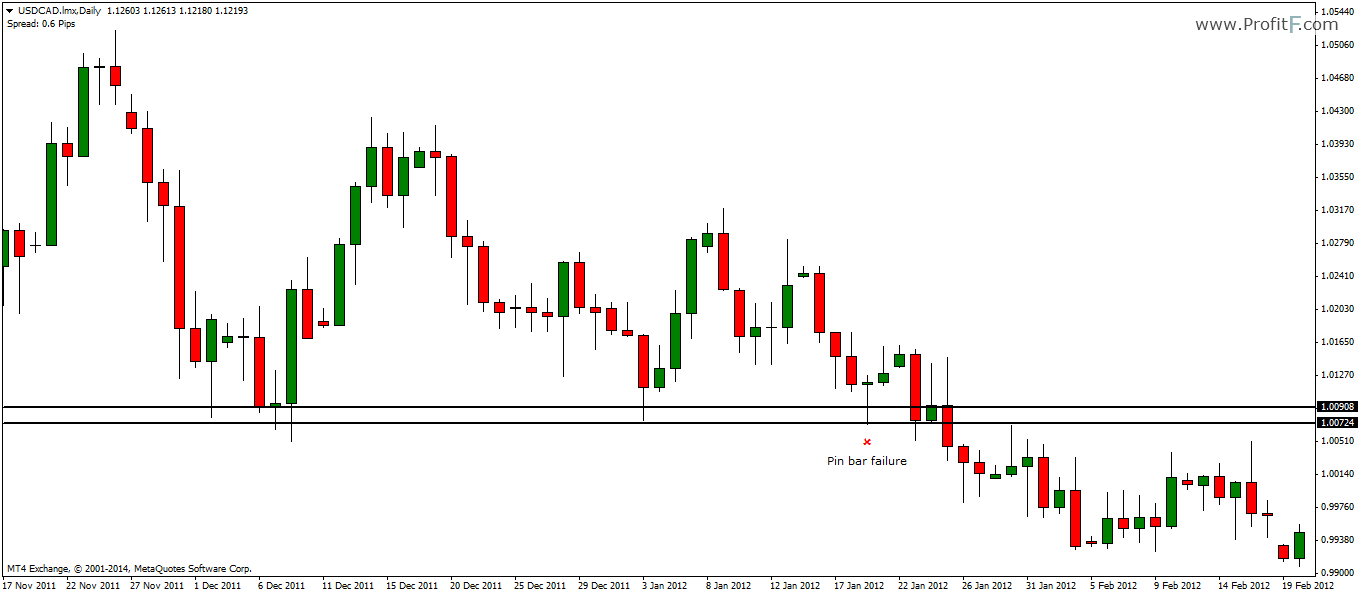
Figure 6: Pin bar failure
To conclude, pin bars are easy to identify and when taken within the larger context of trading and provide great insights to the trader. Pin bars are best traded with an existing trading system or based on price action strategies such as trend lines, horizontal support/resistance levels or channels and Fib levels.

 (36 votes, average: 4.50 out of 5)


Yes, you can download it soon