The Harmonic Pattern Butterfly is closely related to the Gartley 222 pattern with the main difference being that the Butterfly pattern’s CD extends beyond the XA leg. The Gartley Butterfly pattern is also identified by the classic ‘M’ and ‘W’ patterns. (see more about other forex patterns)
The Butterfly pattern was one of the many harmonic patterns developed by H.M Gartley which were then fine tunes with the introduction of the Fib rations by Scott Carney and Larry Pesavento. Visually, the Butterfly pattern looks similar to the Gartley 222 pattern, especially the Fib ratios between the pivot points.
What is the Butterfly Pattern?
The Butterfly pattern can be found near key market reversal points, usually at intermediate highs and lows. The appearance of the butterfly pattern indicates reversals when it is validated. The chart below gives an illustration of the Bullish and Bearish butterfly patterns.

The main rules of the Bullish and Bearish Butterfly patterns are as follows:
Butterfly Rules
From Point D, a trade can be entered with stops at or above (below) the price point at D.
Butterfly Target Levels
Once a position is entered at D, profits can be booked at 61.8% of CD with the second target at 127.2%. Despite the above rules, in real time such text book patterns that qualify every point of the swing legs do not form as expected, so traders should be a bit flexible while identifying the butterfly patterns.
Bearish Butterfly Pattern – Sell Trade Example
The following chart illustrates a bearish butterfly example:
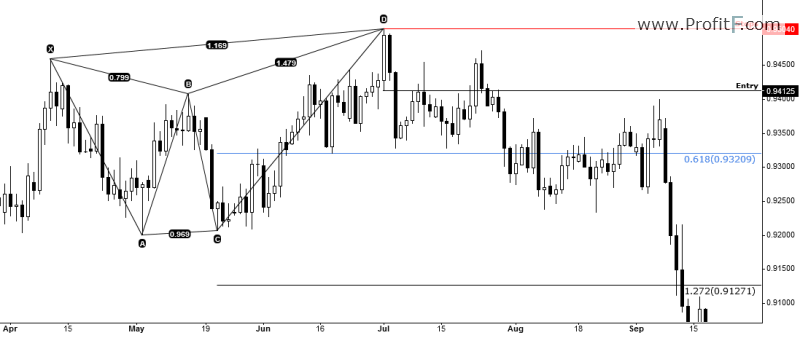
Once the swing/pivot point at D is formed, price starts to break down and promptly reaches the target of 61.8% and 1.272% of the CD leg.
While the above bearish butterfly might not have met all the requirements as outlined, it does demonstrate that traders have to be a bit flexible when applying the ratios.
Bullish Butterfly Pattern – Buy Trade Example
The following example illustrates a bullish butterfly trade example:
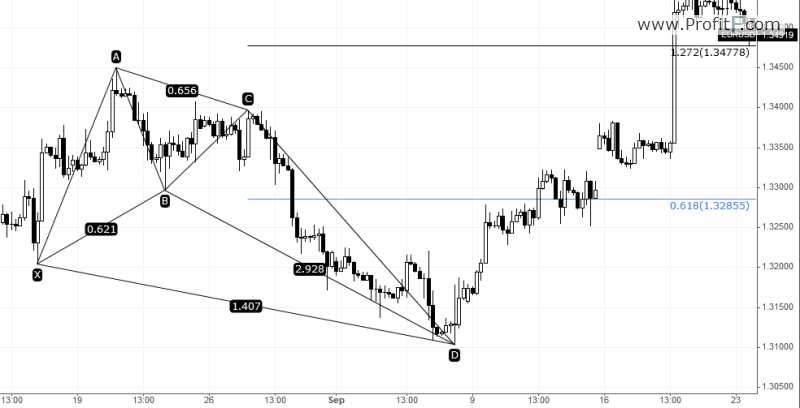
Placing a long order above the high created at point D saw the price rally to 61.8% and then 127.2% of the CD leg. Here again we can see how the bullish butterfly pattern, did not meet all the rules specified in the trade rules but managed to rally and meet the price objectives.
The butterfly pattern therefore is an easy to trade harmonic pattern which offers a highly reliable trade probability. The risk/rewards may of course vary depending on how far the CD leg extends and therefore traders should be looking to trade only those butterfly patterns that offers a lower risk and higher reward trades.


 (18 votes, average: 3.94 out of 5)