
Trading Flags and Pennants Patterns
Flags and pennants chart patterns are primarily known for signaling a continuation of the previous trend. The flag or pennant chart pattern is formed right after a bullish or bearish price movement followed by a period of consolidation. This is where price tends to take a pause before continuing in the original direction of the trend.
Flags and pennants chart patterns are easy to identify and can be found just after an important news release such as the NFP/unemployment reports or other important economic news release. (read more about NFP here)

Trading the Flag Patterns
The flag pattern is identified by two main elements.
A bullish flag is identified by a downward sloping flag, where as a bearish flag is identified by an upward sloping flag.
The following chart shows the bullish and bearish flag patterns along with how they are traded.

Figure 1: Bullish Flag Example
After price starts to consolidate and move gradually lower, look to buy on the break out of the flag. The price objective is expected to be the minimum previous distance of the flag post from the break out price level. The Figure 2 shows an example of a bullish flag trade example.

Figure 2: Bullish Flag Trade Example
Figure 2 above shows a bullish flag example. We notice how the price moved rapidly before entering a period of gradual exhaustion, shown by the number of candles within the flag. After breaking out of the flag pattern, price rallies to reach not only the minimum price objective but rallies to make higher highs. The stops for the bullish flag are placed just at the low prior to the break out from the bullish flag.
A bearish flag is characterized by a sharp drop in price followed a period of gradual price congestion moving higher within a channel. On break out of the bearish flag, price then travels a minimum distance of the flag post. The Figure 3 illustrates a typical bearish flag pattern.

Figure 3: Bearish Flag Example
The next chart below, Figure 4 shows an example of how the bearish flag is traded.

Figure 4: Bearish Flag Trade Example
An interesting point to bear in mind in the above bearish flag trade example is the retest of the break out level. This retest may or may not happen, but it does remind traders that trading on a retest of a break out price level is always a safe option. However, this is not always as the case as in most cases with flags, the break it sharp and quick.
In the case of the above bearish flag break out, despite the rally back to retest the break out level, price did manage to reach the minimum price objective.
Trading the Pennant Patterns
The pennant patterns are similar to flags, with the main difference being that the patterns are formed as converging trend lines into a triangle. The bullish and bearish pennant chart patterns work on the same principles of the flag patterns. The following chart shows a bearish pennant pattern.

Figure 5: Bearish Pennant Example
As seen by the above chart, the bearish pennant pattern is identified by converging trend lines forming a pennant that is sloping upwards at the bottom end. The pattern is somewhat similar to a symmetrical triangle formed within a smaller number of candles, but preceded by a sharp bearish drop.
Figure 6 illustrates a bearish pennant example. In this example, we also get to see a fake out that occurred out of the bearish pennant/symmetrical triangle. When taken in view of the larger chart pattern, the bearish pennant, the fakeout could have been easily avoided. Price eventually manages to break lower out of the pennant pattern eventually retesting the break out before dropping to reach the price objective.

Figure 6: Bearish Pennant Trade Example
The bullish pennant pattern is the opposite of the bearish pennant pattern and almost similar to a bullish flag pattern, with the exception that the pennant is formed by converging trend lines forming a symmetrical triangle. The chart below, Figure 7, shows a bullish pennant example and how it can be traded.

Figure 7: Bullish Pennant Example
Figure 8 represents a trade example of a bullish pennant pattern. Here we can see after a rapid rally, prices started to consolidate within a tight range forming a pennant. Upon break out from this pennant, price then subsequently rallied to reach the projected target.
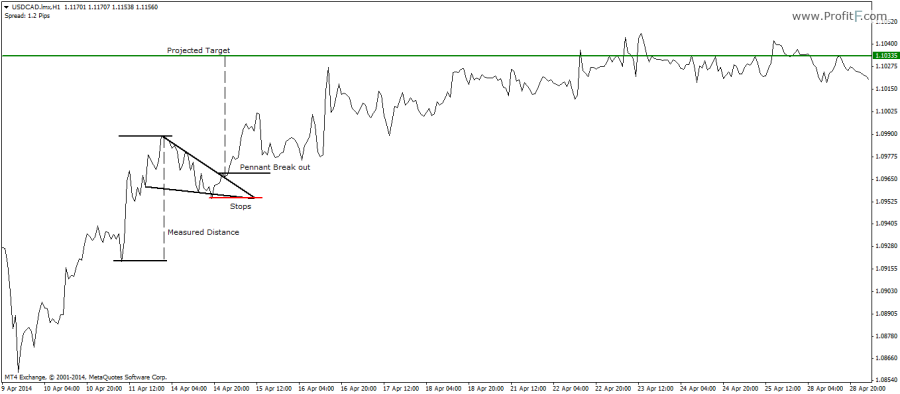
Figure 8: Bullish Pennant Trade Example
The flags and pennant patterns can be a good way to trade chart patterns. Because they are continuation patterns, the chances of them failing a very low and therefore can offer a safer way to trade chart patterns, especially for those who are just getting started with this approach to trading.

 (22 votes, average: 4.41 out of 5)


Add your review