
There are a few key elements that new traders should focus on which serve as the basis for all successful Forex trading and analysis. Among these, Multi Timeframe analysis is arguably one of the most important.
Many new traders get side tracked on their learning journey wasting time trying out the latest indicator or following the latest “fool proof” strategy instead of focusing on the basics which can help improve their trading ability far quicker than any marketing gimmick claims to be able to.
One of the big problems that many new traders have, is that they get caught up just focusing on one time frame. Typically, this is most common among traders who like to trade intraday or seek to apply scalping strategies. They drop down to the 15 minute or 5 minute charts where there seems to be more action and more opportunity and they start trading only to discover that they often find themselves on the wrong side of the market.
There are many reasons why this can be the case but generally is due to the fact that the trader is only paying attention to one-time frame and isn’t aware of the more important higher time frame levels or direction of the higher time frame trend.
Perhaps one of the most common strategies applied by intraday traders is the breakout (read more about BreakOut Trading). Typically, traders will mark out the high/low of the day or of the session and look to trade price as it moves beyond those levels. However, this strategy is also a victim of once of the class mistakes which new traders make: trading breakouts on lower time frame level directly into key higher time frame levels.
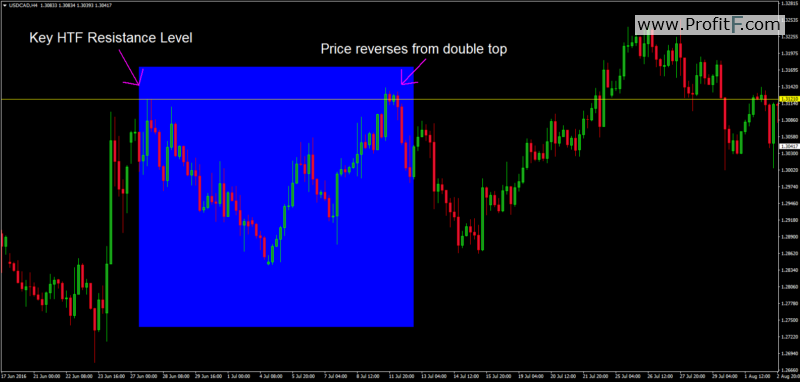
In the above chart you can see that we have a clear double top formation on the H4 timeframe. After price fails at the first high and sells off, we have a clear resistance level on the H4 timeframe and traders will be watching price as it trades back up to that level looking to sell or take profit on any long trades entered below the level. Find best forex broker here
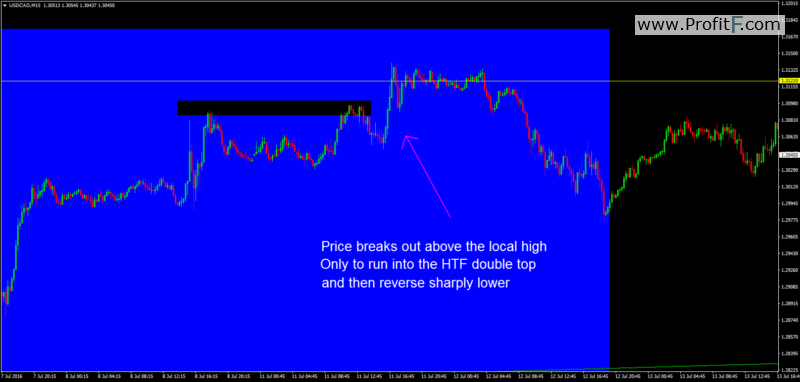
However, if we look at the same chart on the 15-minute timeframe, just focusing on the area of the second top, you can clearly see the sort of mistake that new traders often make. They look at price and see a key local resistance level and look to trade long as price breaks out above it. However, you can see the gold horizontal line marks our key H4 resistance level and once price hits that level it reverses sharply.
Many new traders who only focus on one-time frame would be left scratching their heads wondering why the break out failed. However, if they had conducted their Multi time frame analysis they would have noted that presence of a key HTF resistance level. In this instance, the better opportunity was not to go long on the lower time frames but in fact to go short based on the higher time frames.
Ignoring Higher Time Frame Indicators
Many traders like to incorporate indicators into their trading and among the range of indicators used, momentum indicators ar the most popular. Momentum indicators measure the strength of price and identify swings as either being oversold or overbought. As such they can be particularly useful in helping traders find entry points to key reversal and trend continuations. However, one of the key mistakes that a lot of new traders make is not referencing higher time frame indicators.
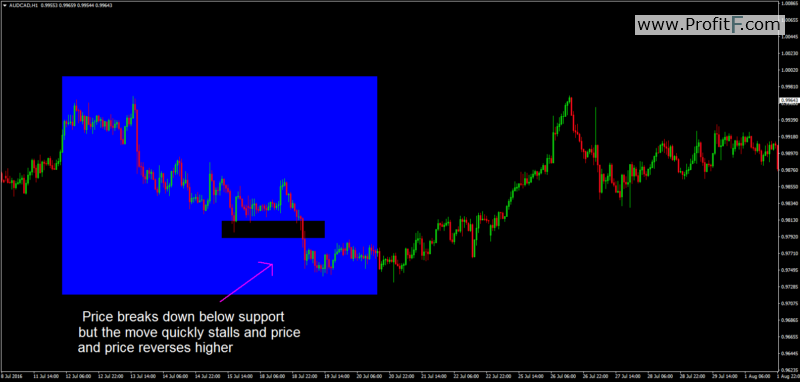
In the above image we can see price breaking down through a clear support level having sold off from a recent high point. This would be a typical area that many traders would look to set shorts, however, you can see that shortly after breaking down through the resistance level price stalls and reverses higher.
How come?
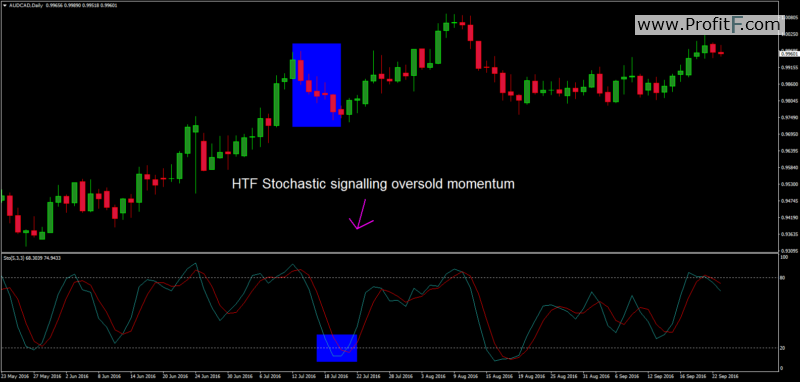
Looking at the higher timeframe stochastics indicator you can see that the period which looked to be a good opportunity for selling on the lower timeframes was actually a period of exhausted bearish momentum on the higher timeframes. With the stochastics having moved into oversold territory it was unlikely that the move was going to continue much further and was actually a much better buying opportunity.
Trading Counter-Trend
Another key error made by new traders who forsake multi timeframe analysis, is trading against the HTF trend. This is not to say that trading counter trend does not wok but for the most part the best opportunities are found trading with the trend. Trading counter trend is a far riskier proposition and typically a far less successful venture.
We looked earlier at how many traders find themselves focusing on just one time frame and in doing so fall foul of higher time frame levels and higher time frame momentum. The same problem occurs when traders find themselves caught out against the higher timeframe trend.

The chart above highlights a classic scenario very similar to what we saw with traders trading against the higher timeframe momentum. You can see that rice puts in a double bottom and starts to trade higher, alerting traders to the potential for longs. As price breaks about above the reaction high this is a typical area where many traders would initiate long positions. However, as you can see, the move quickly stalls and price reverses and sells off lower.
How come?
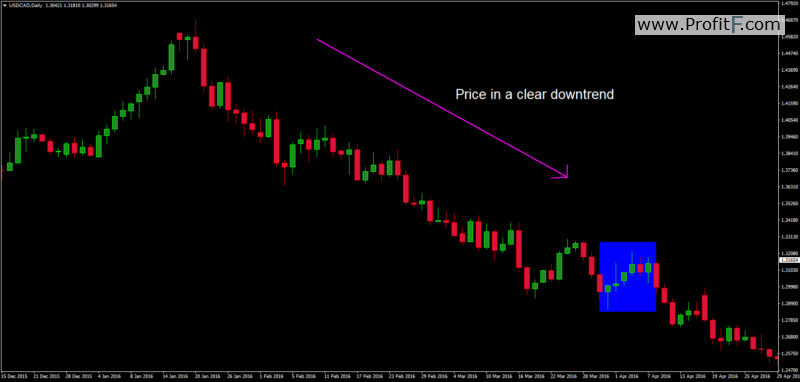
Once again, if we refer to the higher time frames the situation becomes clear. You can see on the daily timeframe that price is in a clear downtrend making a series of lower lows and lower highs. When the market is moving in this fashion the best opportunities are found to the short side as both trend and momentum are on the seller’s side.
Hopefully by now you can see just how important multi timeframe analysis can be in helping you avoid the common mistakes that so many new traders unnecessarily make. New traders should look to develop a solid process for integrating multi timeframe analysis into their weekly and daily chart study to help them better approach the market. No matter which timeframes you prefer to trade it is always beneficial to take a step back and look at the bigger picture to help highlight both opportunities and risks to be managed.
 (3 votes, average: 5.00 out of 5)


Add your review