
Among the vast array of technical indicators used by traders, momentum indicators continue to prove themselves a firm favourite and form the cornerstone of many classic trading strategies.
Firstly, momentum refers to the strength of price with bearish momentum being the strength of a downward move in price and bullish momentum being the strength of an upward move in price.
Momentum indicators measure swings in price to and essentially look to determine whether price is overbought, where bullish momentum is overstretched, or oversold, where bearish momentum is overstretched.
Momentum indicators are typically bound oscillators which means their readings fluctuate between an upper and a lower limit.
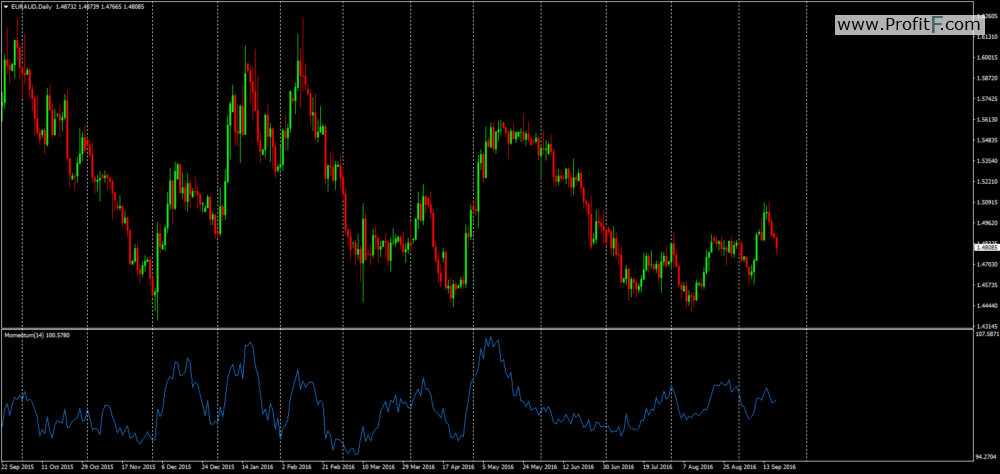
Many new traders will automatically turn to the Momentum indicator which is a default indicator on MT4 platforms. Essentially, the indicator looks at price in relation to where price has been over a specified lookback period with a view to identifying price as either overbought or oversold. The indicator oscillates around a centreline of 100 which might or might not be shown automatically. The higher above 100 the indicator moves; the more overbought momentum is considered to be. The further below 100 the indicator goes; the more oversold momentum is considered to be.
However, in this article we are going to look at two other momentum indicators;
the RSI indicator and
the Stochastics indicator, which are among the most popular forex technical indicators.
The RSI indicator gives readings based on a calculation which measures the average gain of price divided by the average loss of price over a specified time. The default settings on the indicator are a 14 day lookback period and a 70 limit indicating overbought and a 30 limit indicating oversold. Download default MT4 RSI indicator
The typical way that traders use these indicators can be split into two categories: The first is where traders look to fade price based on exhausted momentum when the indicator moves into extreme territory, the second is where traders look to identify divergence between the indicator and price, suggesting potential for a reversal.
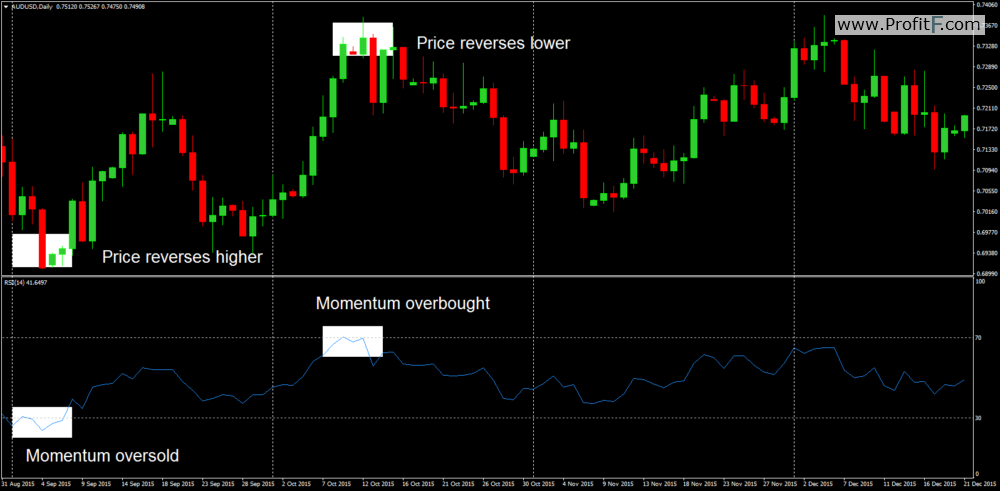
In the above chart you can see we have two examples of overstretched RSI momentum. First you can see where the indicator has moved down to the 30 threshold suggesting momentum is overstretched to the downside, before reversing higher, and then shortly after as price moves higher you can see that the indicator moves into overbought territory suggesting that price is overstretched to the topside, before price reverses lower.
This demonstrates the typical reaction that traders are anticipating when the indicator moves into extreme territory looking to buy when the momentum is oversold and sell when momentum is overbought
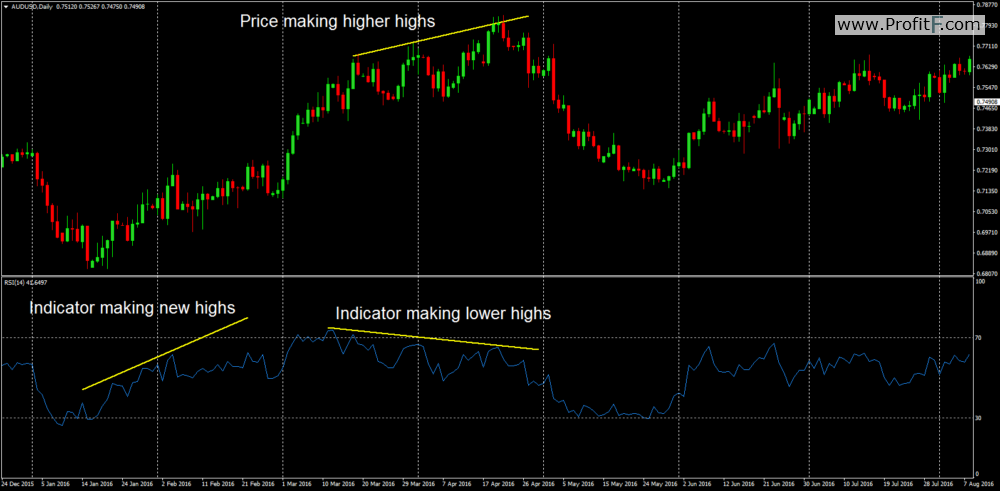
In the above chart you can see a fantastic example of bearish divergence. (Read more about Forex Divergence trading) Price is travelling higher, putting in successive new highs suggesting that a bullish trend is likely to continue. However, looking at the RSI indicator suggests that bullish momentum is actually fading from the market. Initially as price was rising, the indicator was putting in new highs showing that bullish momentum was building in the market. However, you can see that eventually after reaching overbought territory the indicator starts to move lower even though price is continuing higher. This suggests that the move does not have further to go and in situations like this traders should be alert to the potential for a reversal lower.
The opposite is true for bullish divergence whereby we look to identify price moving lower putting in new lows whilst the RSI indicator starts to move higher putting in higher lows, indicating the likelihood of a bullish reversal.
The Stochastics is a slightly more advanced indicator and has some added functionality which makes it popular with traders. The indicator measures the closing price of an instrument against a range over a specified lookback period, again to identify price as either overbought or oversold. The default settings for the indicator on MT4 are a 5,3,3 lookback period with an upper limit at 80 indicating overbought and a lower limit at 20 indicating oversold. Download Stochastics default MT4 oscillator indicator
Unlike the RSI indicator the stochastics indicator has two lines, the K line which is the faster line and the D line which is the slower line. As well as signalling overbought and oversold conditions, the crossing of the K line above the D line is a bullish signal indicating a shift to positive momentum whilst a crossing of the K line below the D line is a bearish signal indicating a shift to bearish momentum.
So instead of just buying when the indicator reaches the lower threshold, with the stochastics we have the option of waiting for the indicator to move to the lower threshold but then also waiting to see the K line cross above the blue to give us our bullish entry.
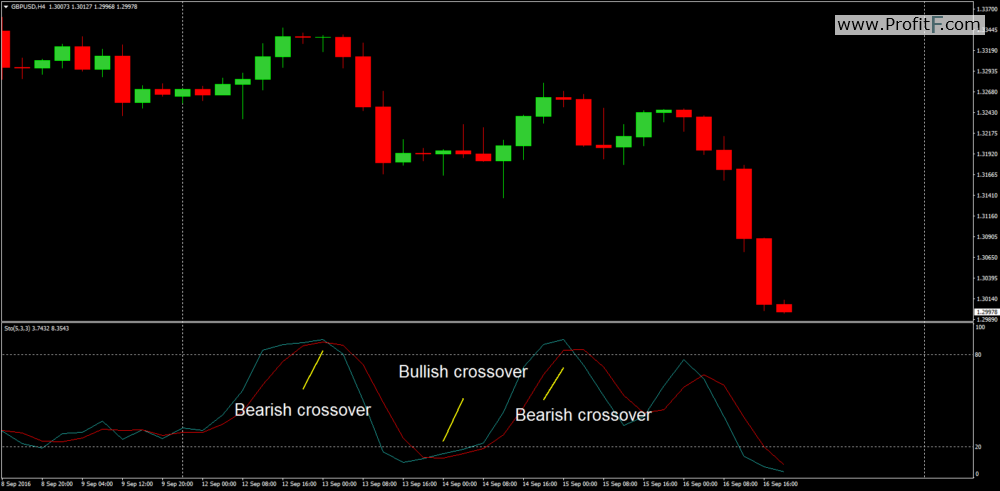
In the chart above you can see we have three examples of a bearish crossover, a bullish crossover and then a final bearish crossover. Using the crossing of the stochastics lines in conjunction with the overbought/oversold reading is a fantastic way to use the indicator and can help you gain more precise entry points to key reversals.
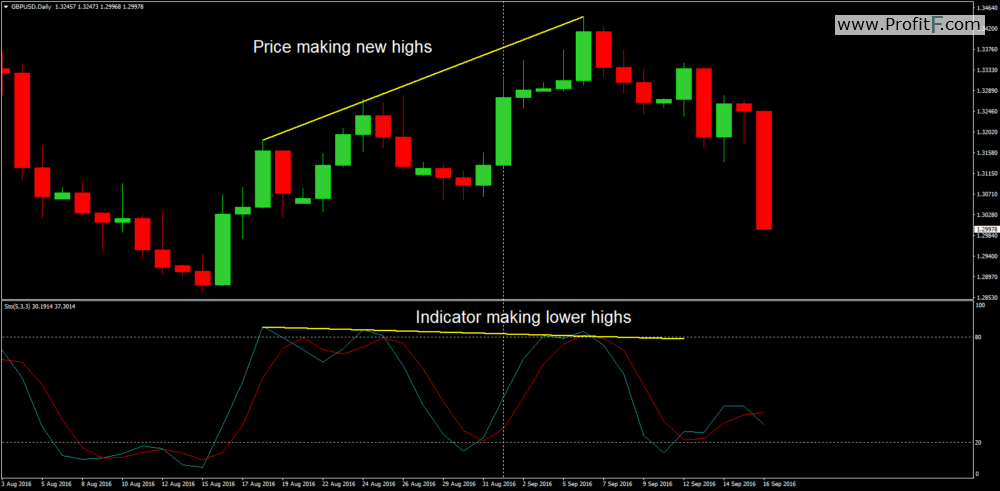
You can see that stochastic divergence works in exactly the same way as RSI divergence whereby we are looking for a move in price which is not supported by the indicator. In the above MT chart you can see that price is making a series of new highs, whilst the indicator is actually making lower highs – again suggesting that a bearish reversal is possible. Once more, if this were a bullish scenario we would want to see price making new lows whilst the indicator starts to put in higher lows, suggesting that bearish momentum is waning and bullish pressure is building.
Hopefully now you can see just how versatile and effective momentum indicators can be in helping you identify trading opportunities, whether you are looking to fade price as the indicators suggest that momentum is overstretched or using the indicators to identify divergence and potential reversals.

 (5 votes, average: 4.80 out of 5)


Add your review