

Explanation of 2 Bar Reversal Pattern, 2BarReversal Pattern meaning. What Is 2 Bar Reversal Pattern in Forex? 2 Bar Reversal Pattern Definition
2 Bar Reversal Pattern – Price Action candlestick pattern that can be found on any TF (time frame). ( ? What is Price Action? ) 2-Bar-Reversal pattern – contain 2 candles. For a “bearish 2 Bar reversal” the 1st bar must go up. The 2nd candlestick must then open and snap back lower. In the above example, you can see “2 Bar Reversal Pattern” on chart.
Trading the 2-bar reversal price action trade set up
The 2 bar reversal price action set up is an uncommon trade set up mostly due to the fact that it is misunderstood. Price action traders also tend to confuse the two bar reversal set up with other individual candlestick patterns. However, despite the confusion, the 2 bar reversal set up in price action trading is a very solid trade set up that is indicative of a reversal. The reversal that the 2 bar set up presents can either be a reversal to the main trend, or merely a corrective move or retracements to the main trend. In this article, we’ll explore what is the 2 bar reversal price action trade set up, why it is formed and how to trade this price action set up, both within a trading system as well as in isolation.
What is the 2 bar reversal price action set up?
This price action trade set up comprises of two bars. The two bars, in order to qualify this pattern must be significantly large and preferably have small upper and lower wicks. When a bearish bar followed by a bullish bar appears at the bottom, the 2 bar reversal is indicative of a bullish price action that is imminent. Likewise, when a bullish bar followed by a bearish bar is formed at the top, it is indicative of a bearish momentum coming into play in the markets.
The 2 bar reversal price action set up can be formed in any time frame of the charts. What makes this significant is the fact that they are nothing but the two price bars of a higher time frame. For example, a 2 bar formation in H1 charts is nothing but a single candlestick on a 2-hour chart. Or a 2 bar formation on the H4 chart, is a single candlestick or bar on the 8-hour chart and so on.
Because the 2 bar reversal price action set up comprises of two opposite sentiments, when viewed through the higher timeframe, they most often signify a pin bar.
( ? What is Pin Bar? )
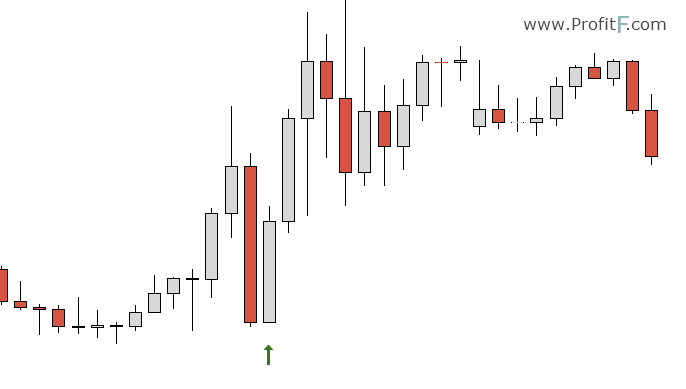
The chart below shows a 2- bar reversal on the H1 charts:
When we switch to the 2-hour chart, we notice that the price action of the 2 candles from H1 chart converts to a pinbar type of formation on the 2-hour charts:
What does the 2 bar reversal PA pattern indicate?
The appearance of the 2 bar reversal price action set up primarily indicates a fight between bulls and bears, or buyers and sellers. Often signified by large bearish and bullish bars, when they occur next to each other, the 2 bar reversal pattern often signifies a rejection of lower or higher prices by the markets where the preceding price action candle shows the market sentiment.
Therefore, when a bearish and a bullish bars appear in the 2 bar reversal method, the sentiment is in the direction of the bullish candlestick pattern and thus indicative of a bullish market sentiment. Likewise, the appearance of bullish and bearish bars appears within the 2 bar reversal method, it indicates bearish market sentiment.
Quite often the 2 bar reversal methods can also include the second candle to be an engulfing pattern price action candle. Such patterns are even stronger and valid.
( Read more about engulfing candlestick pattern/ Download engulfing candlestick indicator )
Trading the 2 bar reversal Price Action pattern in isolation
When trading this price action pattern isolation, the holding period is for no longer than one candlestick or bar. It can be more, provided the market gives us further price action clues.
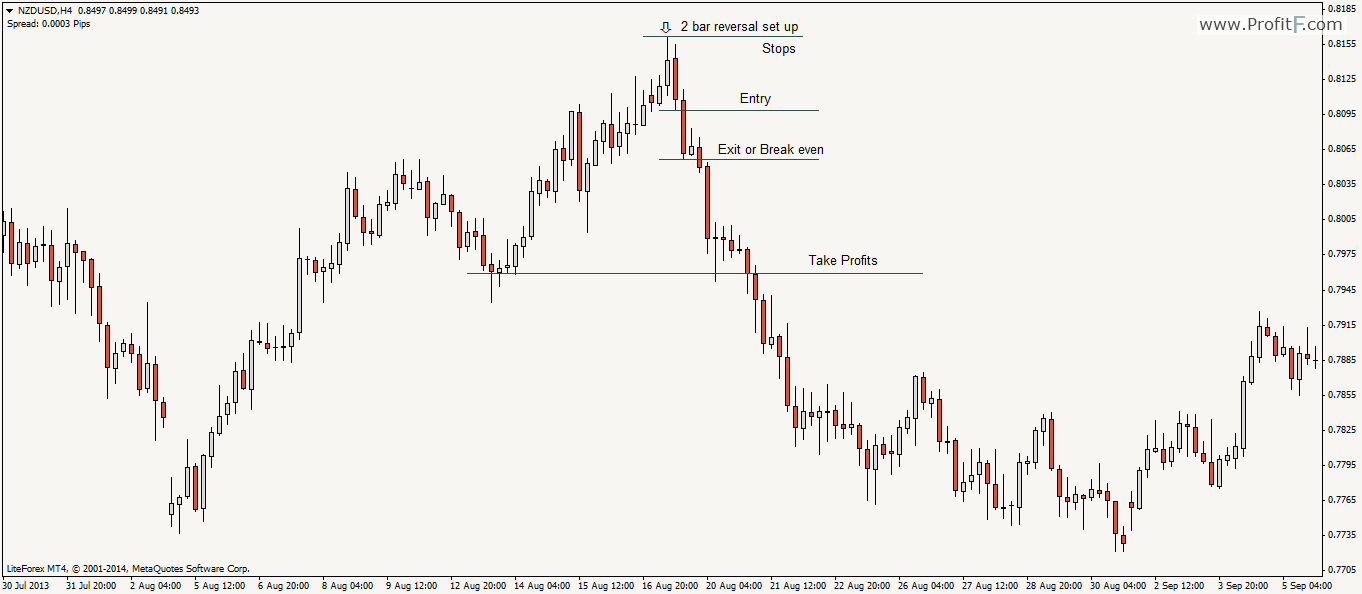
The chart above shows how a short position was taken based on the 2-bar reversal price action set up.
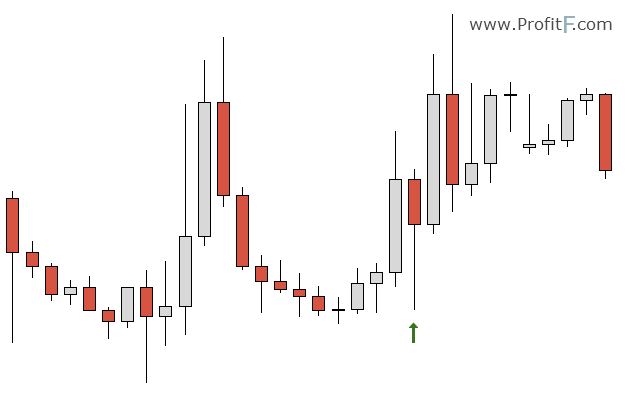
In the next chart, we show an example of a long trade set up. Here, the 2-bar reversal trade set up can also be regarded as a bullish engulfing candle, thus giving it a higher probability.
The long example of the 2-bar reversal price action pattern here offers a great risk/reward trade when targeting previous resistance levels.
Trading the 2 bar reversal within a trend
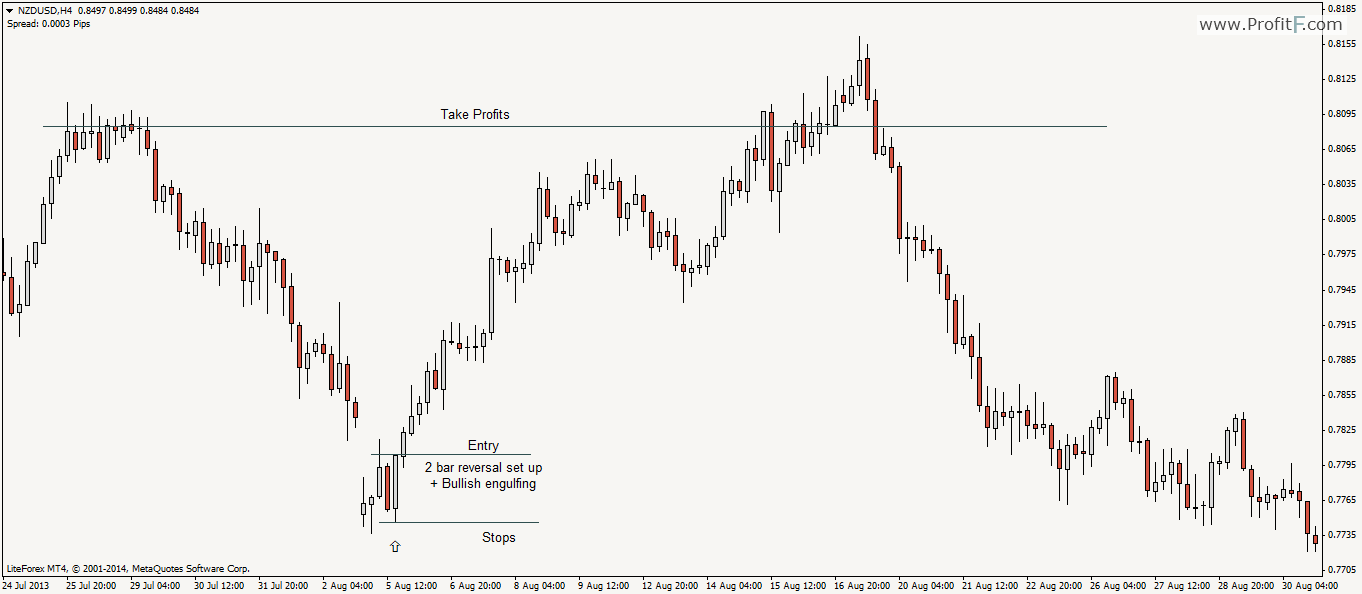
The 2 bar reversal can also be traded within a trend, especially at retracements. The appearance of a 2 – bar reversal pattern, a bearish candlestick followed by a bullish candlestick can be seen as a signal of the end of the retracement, especially when this price action pattern occurs at a previously identified support zone.
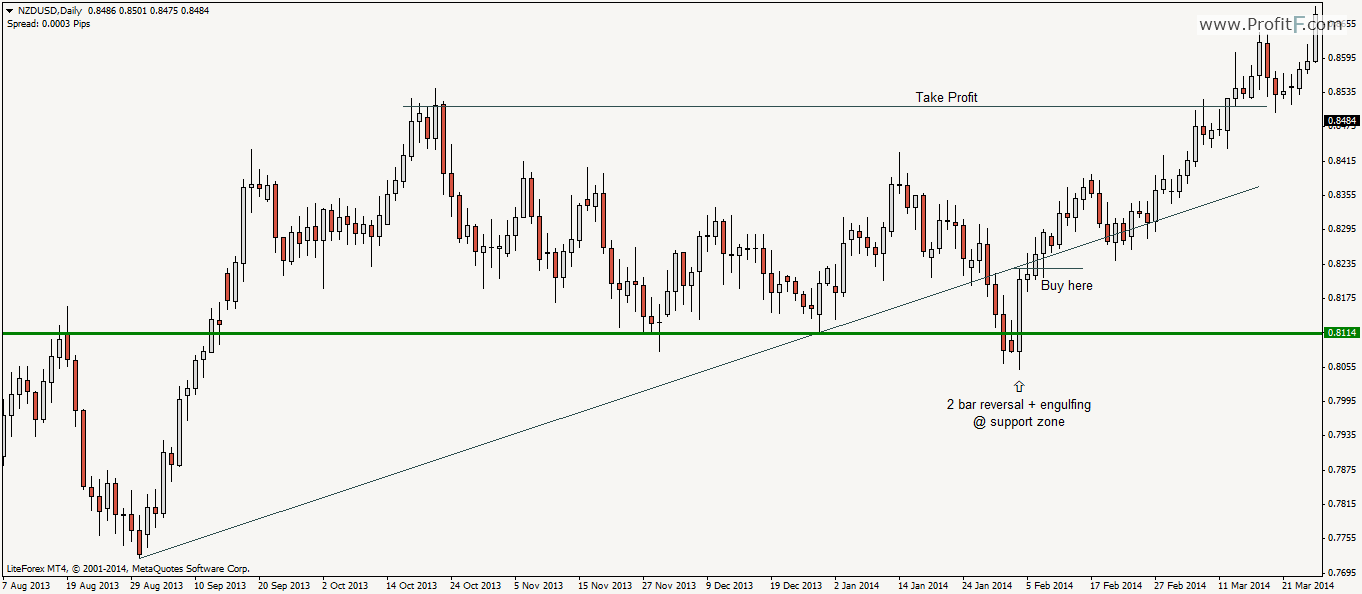
In the above example, we notice a 2 bar reversal pattern formation which also happens to be an engulfing candlestick pattern. The appearance of this pattern near a previously known resistance turned support level is a clear indication that the retracement is complete and that buyers are in control. Taking a long position at the high of the bullish reversal bar, targeting the previous high yet again gives trades a very low risk, high probability trade set up.
Trading the 2 bar reversal price action set up – in Summary
To summarize, trading the 2 bar reversal price action set up:

 (23 votes, average: 4.30 out of 5)


Add your review