
Renko charts are a form of chart types, besides the frequently used Candlestick charts, line charts and the OHLC bar charts. Renko charts are as ancient as Candlestick charts, and are yet another contribution by the Japanese. The word, Renko comes from the Japanese word of Renga for Brick and that is how the Renko chart is formed, in bricks or boxes.
Renko charts take into consideration only price and therefore considered to be pure price action charts. Unlike other chart types such as Candlesticks or line charts, where price and time is considered, with price plotted on the y-axis and time on the x-axis, with Renko charts only price is considered.
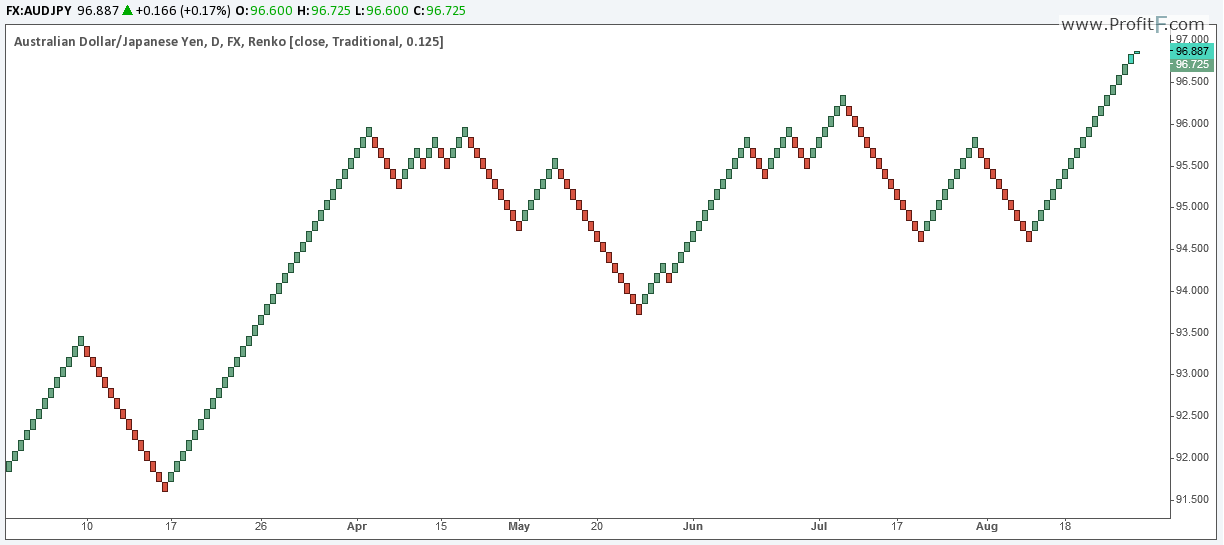
The chart below shows how the typical Renko chart looks like.
Configuring the Renko Chart
The Renko chart can be configured to adjust the box size. This can be specified by the trader. So a box size of 0.0005 would infer a Renko chart with 5 pip box size or 0.005 would be a 5 pip box size for a Yen pair.
Besides the fixed box size, Renko charts can also be configured to dynamically use the ATR value. The default setting is an ATR (14). The ATR method for fixing the Renko box size is used so as to capture the current average true range of price. An ATR is usually ideal for creating Renko boxes for stocks. For forex markets, using a 5, 10, 20 pip fixed Renko box size is ideal.
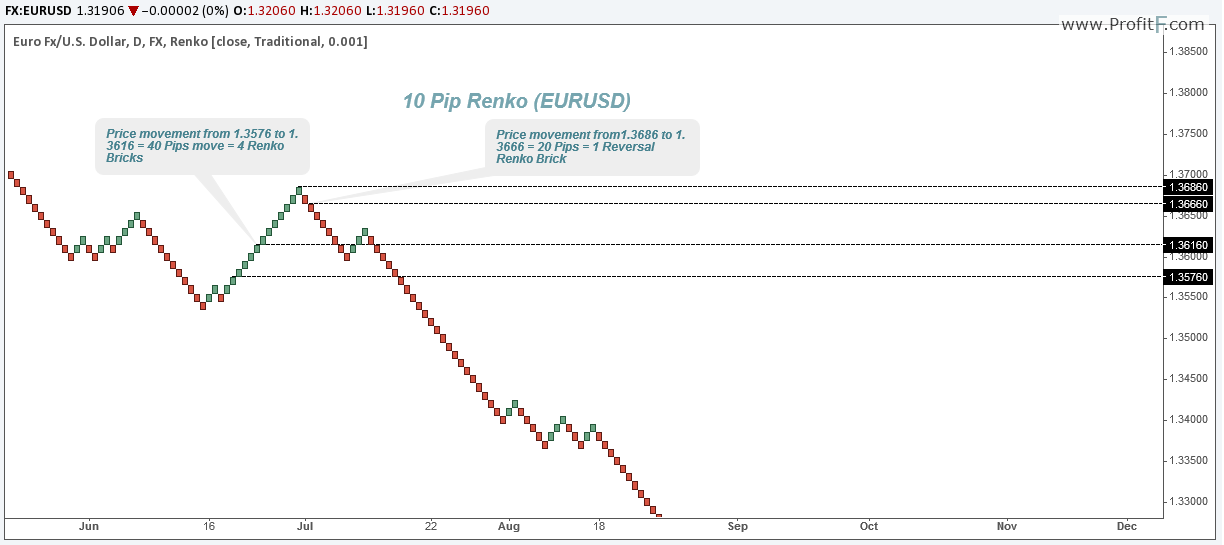
A Renko chart works based on price action. Bullish price is plotted with a Green Renko brick and a bearish price is plotted with a Red Renko brick. For example if we use a 5 pip Renko box size on EURUSD, and if price was currently trading at 1.3000 and price moved to 1.3005, a Renko brick would be plotted. Likewise, for further 5 pip moves, new Renko bricks would be plotted. For reversals, price has to drop twice the Renko box size. In other words, a bearish Renko brick is plotted when price drops to 1.2995, from 1.3005.
The Renko chart below illustrates the above with an example of 10 Pip Renko chart.
Why trade with Renko Charts?
The only downside to using Renko charts is that if price moves in a tight range, the Renko chart is not updated with any new bricks. Also when a trade is entered, time is no longer a factor for the stops or the target levels to be reached.
Simple Renko Trading Strategies
There are many Renko trading strategies, but here we outline a few of the simplest Renko trading strategies that traders can use.
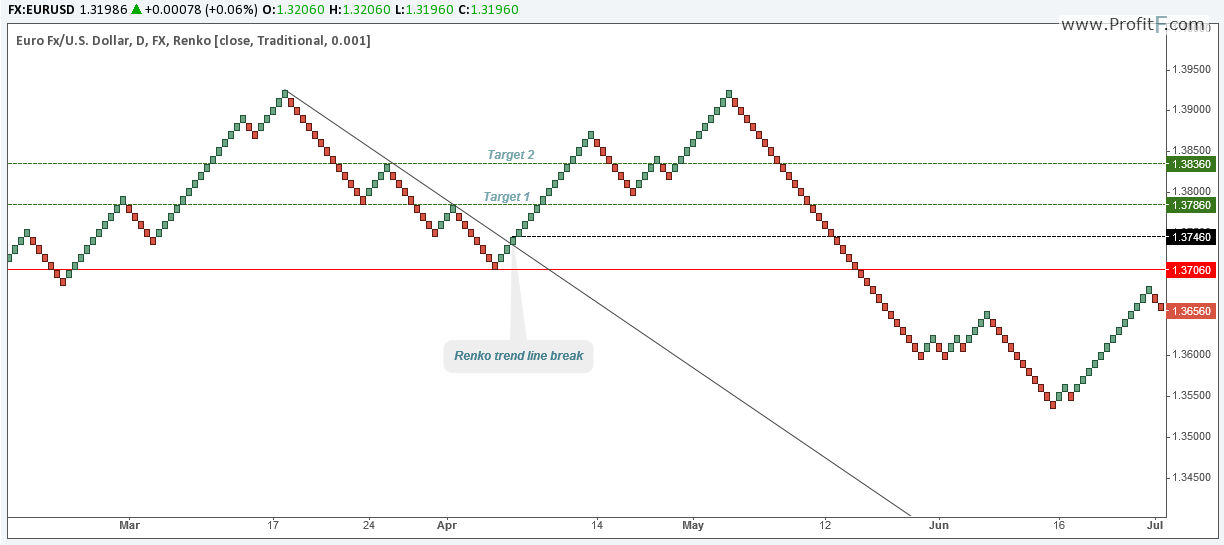
Renko Trend line break Trading
The chart below shows how a trend line break method can be applied to the Renko chart. We notice a minor downtrend in play and plot a trend line connecting the pullbacks. When the trend line is broken, a trade can be entered, targeting the immediate previous support/resistance or pullbacks for booking profits.
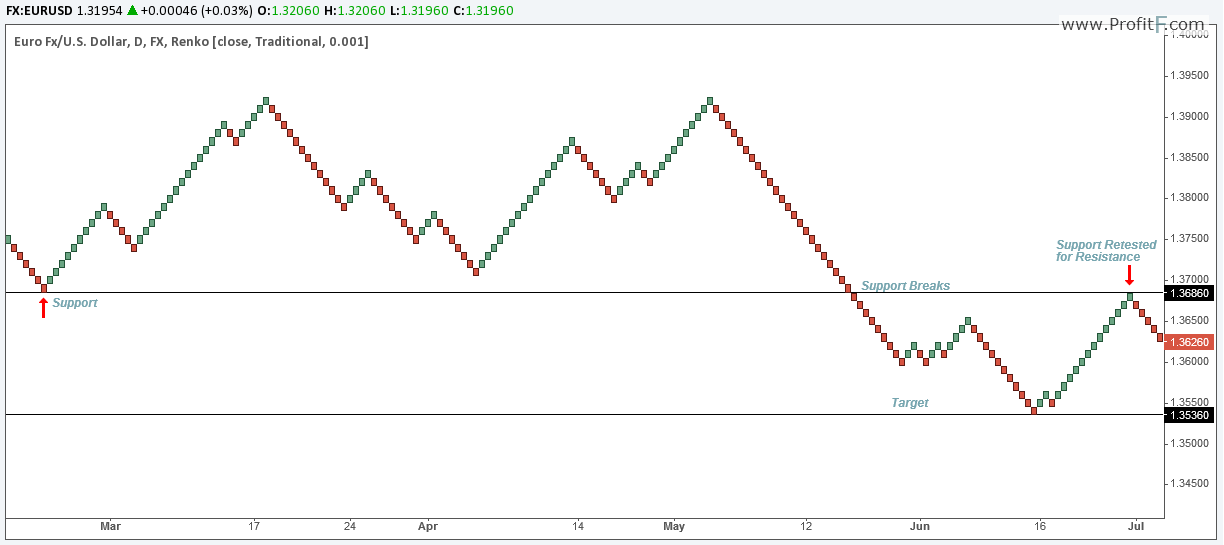
Renko Support and Resistance Trading
In the following chart, we notice how the support and resistance lines are easily spotted on the chart. We see a support level being established which was broken later. Price rallies back to the support line to retest it for resistance, which makes it an ideal price level to short targeting the most recent minor support level.
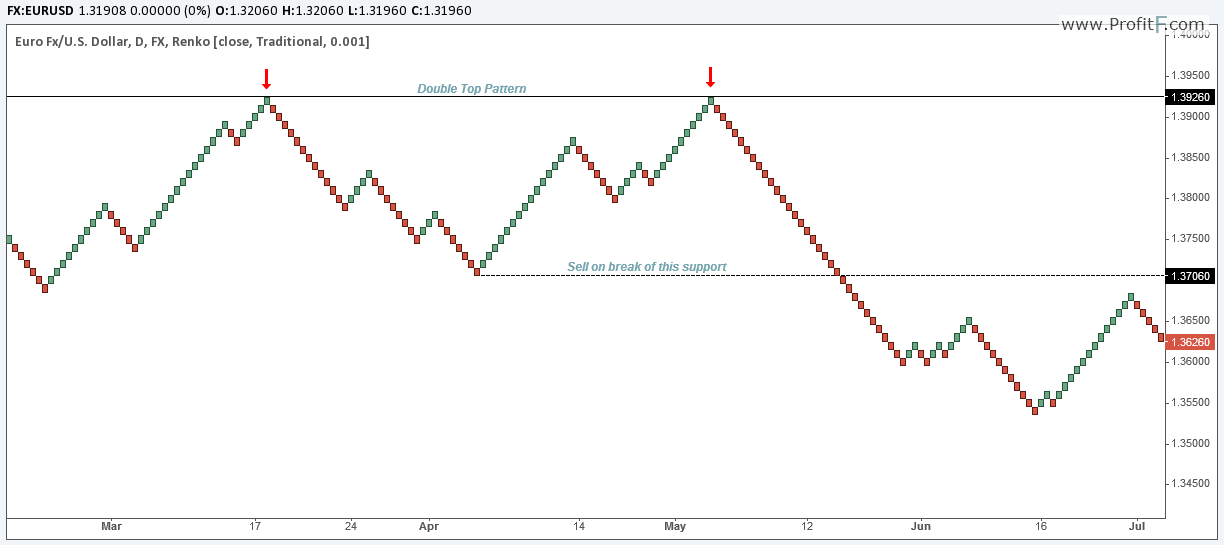
Renko Chart Patterns Trading
The following chart shows a double top formation, which is very clear to the eye. This kind of precision is something that requires a second or even a third look at traditional charts. After the double top was identified, sell positions could be initiated near the support targeting the rest of the price action.
Renko Charts with Indicators
Traditional indicators can also be applied to Renko charts such as Moving averages, Bollinger bands and even oscillators such as the RSI, CCI and so on. In the following chart below we have a simple 5/10 EMA cross over method with Stochastics confirmation applied to the Renko charts.
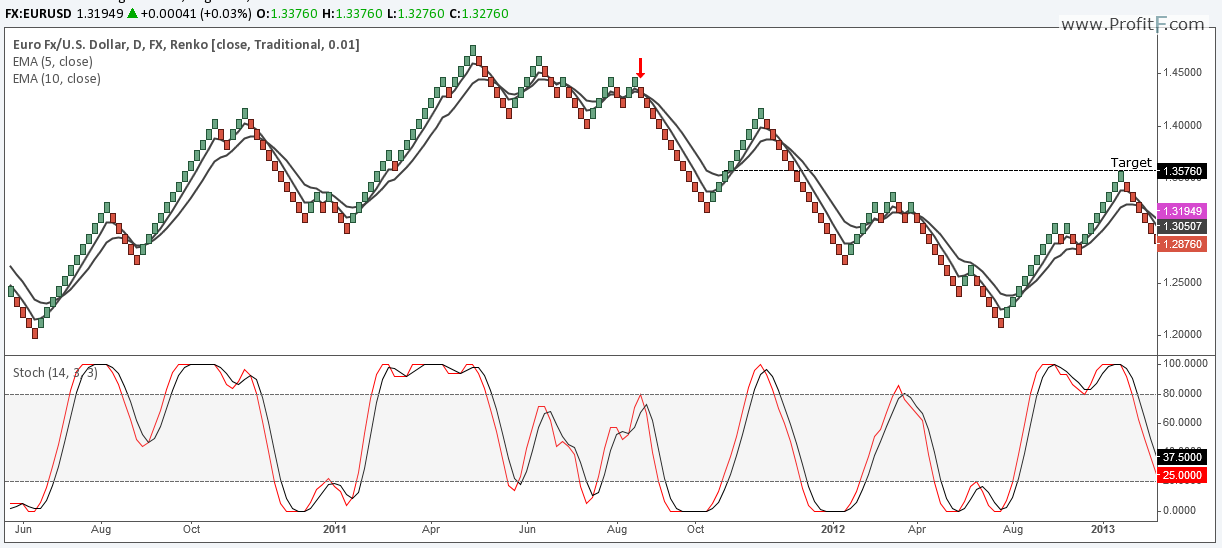
At the arrow marked on the chart, the 5/10 EMA cross over method is very easy to trade with Renko charts. We have many confirmations.
The shorts would be continued to kept open as long as future bearish Renko bricks continue to form, with stops trailed one or two Renko bricks above price. As price shows signs of reversal by forming bullish Renko bricks and closing near the 5 EMA, the short position could be closed with some decent profits to be made.
Conclusion
Renko charts are very easy to understand and it is simple to understand price action trading with Renko charts.. Any trading method that you currently use to Candlestick or line or bar charts can be very well applied to Renko charts, as long as the strategies are not time dependent.


 (11 votes, average: 3.91 out of 5)

Useful article. Thank you!