
TABLE OF CONTENTS:
Download Engulfing Bar indicator for MT4
Engulfing Pattern Definition, Engulfing-Candlestick Pattern meaning. What Is “Engulfing Candlestick Pattern” in Forex?
The engulfing candlestick patterns, bullish or bearish are one of the easiest of candlestick reversal patterns to identify. Because these candlestick patterns are two-candlestick patterns, they are more valid and are often looked upon as reversal patterns. As with any candlestick pattern, the bullish or bearish engulfing pattern takes more priority depending on the time frame that they are formed on. Therefore, when looking to trade with the engulfing candlestick pattern, it is essential to first scan the charts from monthly, weekly and daily and then to the lower time frames. popualr formation for Price Action Trading ( ? What is PAT? )
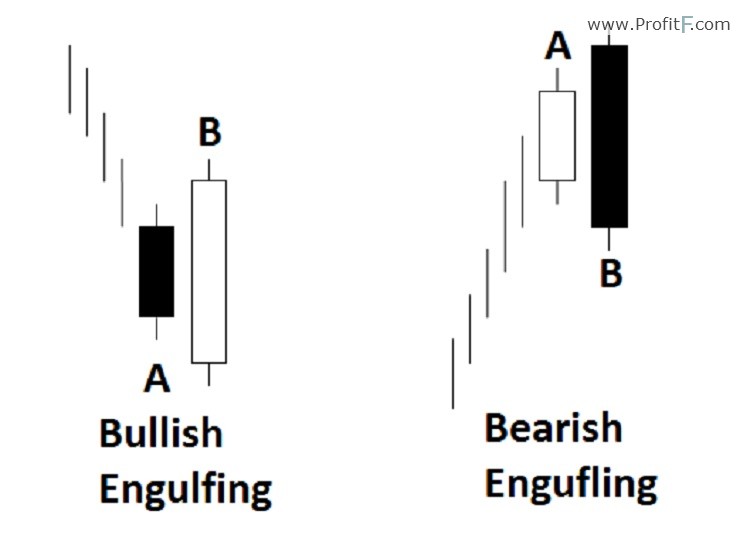
Engulfing candlestick patterns takes two candlesticks to be identified. A bullish engulfing pattern is characterized by a bullish candle whose body, the open and close engulfs the previous candle’s body. Conversely, a bearish engulfing pattern is characterized by a bearish candle whose body engulfs the previous candle’s body.
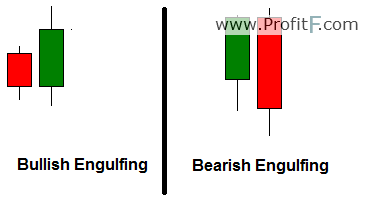
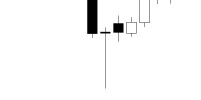
Figure 1: Ideal Engulfing Patterns
For more validity, if the engulfing candle’s high and low engulfs the previous candle’s high and low, the pattern is found to be more valid. The chart below shows different examples of various bullish and bearish engulfing candlestick patterns. In the example chart below, we also point out a false or an invalid engulfing pattern. It is false due to the fact that the open and close (the body) of the second candle does not completely engulf the open/close of the previous candle.
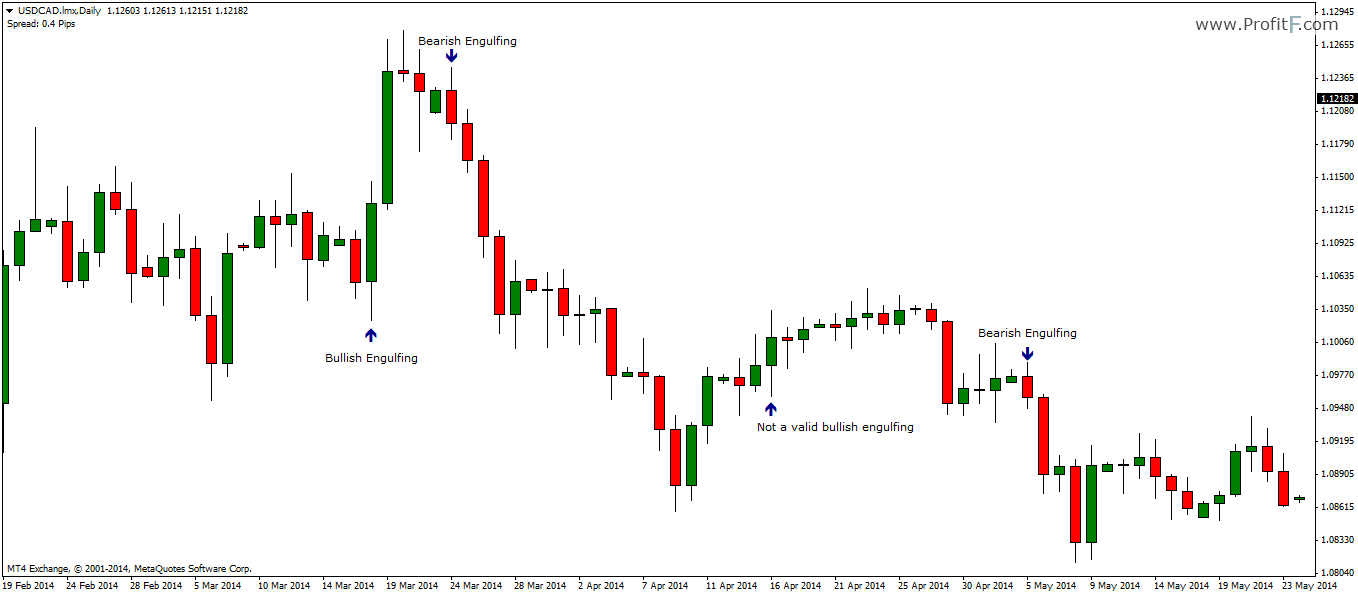
Figure 2: Bullish and Bearish Engulfing Patterns
An engulfing candlestick patterns are usually identified near the tops and bottom. They exhibit extreme market sentiment. In other words, a bullish engulfing pattern tells us that the buyers have overwhelmed the sellers in the market, thus engulfing the entire previous day’s open and closing prices. Conversely, a bearish engulfing candlestick pattern tells us of the sellers overwhelming the buyers and thus indicative of a drop in prices.
Engulfing candlestick patterns can be traded as a reversal candlestick pattern when found at the tops or bottom of a short term trend and validated by support or resistance levels. When an engulfing candle is formed within a trend, they are to be traded as a continuation pattern.
The first step is in identifying the engulfing pattern within the context of the previous trend, of course not to forget the main prevailing sentiment or the major trend.
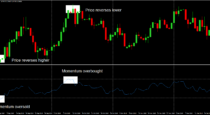
In figure 3, we identify a bullish engulfing candlestick pattern that was formed right near the bottom of a short term down trend. We notice that right after the bullish engulfing candlestick pattern, it was followed by a strong Pin bar and subsequently prices started to push higher. In the same chart, we can also notice how the down trend started by a bearish engulfing candle formed right at the top. ( ? Pin Bar Definition)
As can be seen from the examples in this chart along, the engulfing candlestick patterns are strong patterns and when validated by other methods can offer great insights into taking positions based off these candlestick patterns.
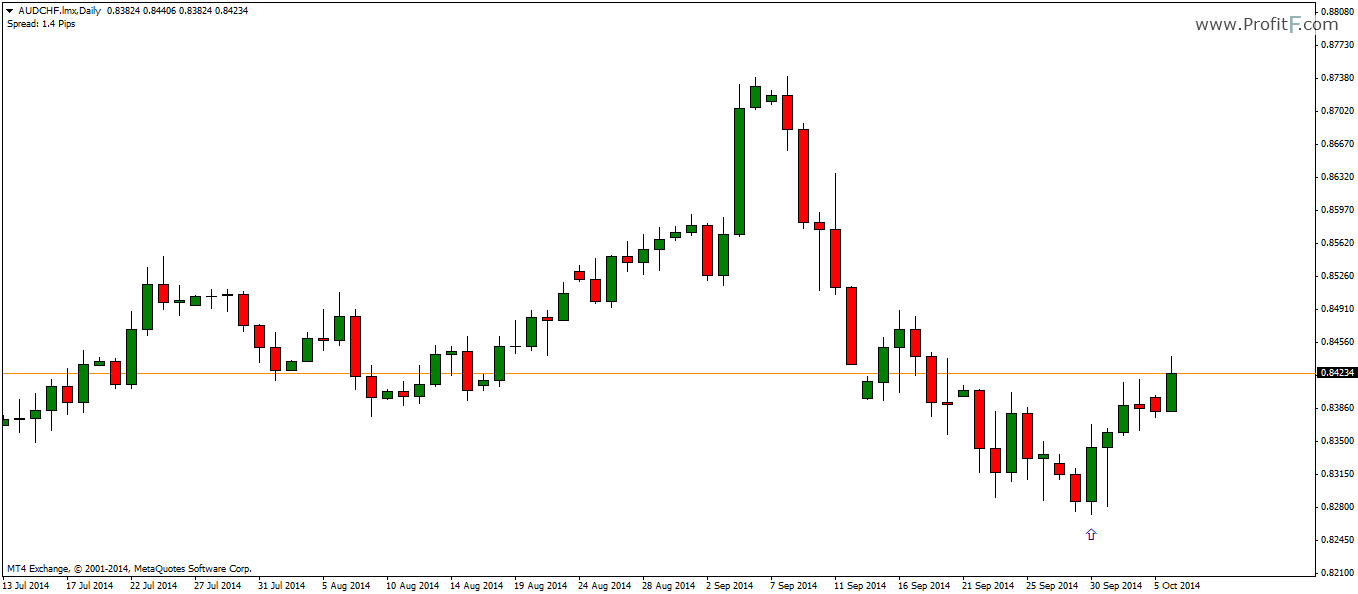
Figure 3: Bullish Engulfing Candlestick pattern
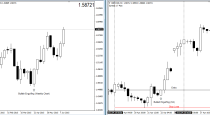
Another great way to trade the engulfing patterns is to scroll down to a lower time frame to fine tune the entry. For example, if you spot a bullish engulfing pattern on a daily chart, then scale into a H4 or H1 charts to pick out entries with lower risk and high probability.
In Figure 4, we identify a bearish engulfing pattern formed on the weekly charts. While most articles will tell you to place a sell order near the engulfing low with stops at the engulfing high, it is a rather crude way to trade. For example, the chart below shows how the bearish engulfing candle was formed. But notice a candle later the high that was made was higher than the high of the engulfing candle
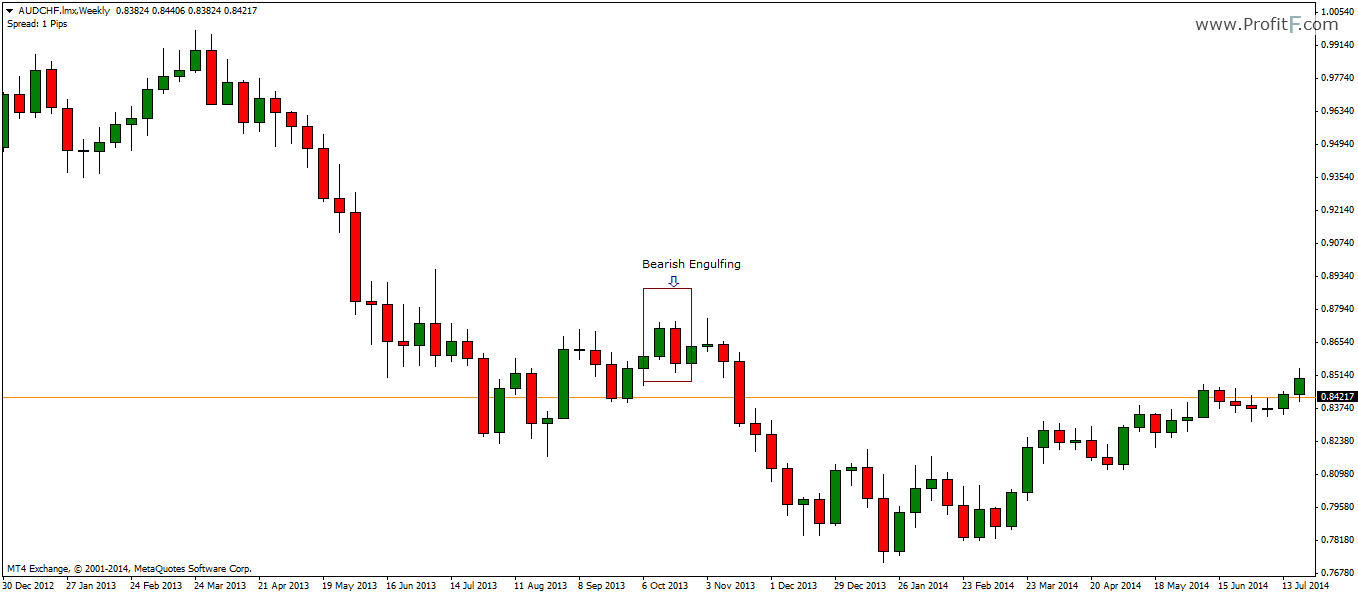
Figure 4: Bearish Engulfing on Weekly Charts
This shows us yet again that when placing stops for trading engulfing candlestick patterns, due caution must be taken. Because it is well known that traders would attempt to place their stops just above the high of the engulfing candle, price can very easily push higher to stop out the traders before moving in the original direction.
To conclude, the engulfing candlestick patterns are two candlestick patterns and when formed near the tops or bottoms can indicate a short term change in sentiment. Depending on the price action, price could either start a new trend in the opposite direction or merely head towards making a correction to the previous trend.
As with any candlestick price action trading, engulfing candlestick patterns must be looked upon within the larger context of the markets and not in isolation.

 (44 votes, average: 4.41 out of 5)

Add your review