
Trader tutorial to guide you on how to set up and customize forex charts
in the Metatrader 4 trading platform.
How to Read Forex Charts (MT4)
Metatrader 4 is one of the most popular trading platforms for retail traders. As more and more forex brokerages offer trading via the Metatrader 4 platform, in this article you will learn about how to customize the charts to your preferences along with giving you a brief overview on some key points on the Metatrader 4 charts.
This article is divided into the following sections:
By the end of the article, you will be able to configure the MT4 charts with ease. This article assumes that the reader has already downloaded MT4 and has an account created as well.
New chart
Default Charts on MT4
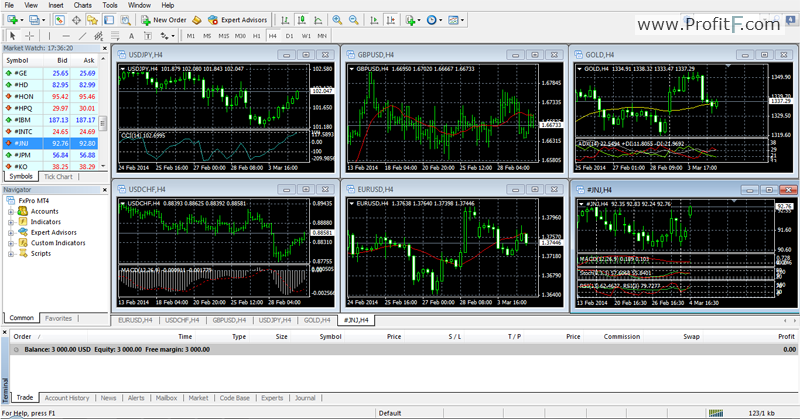
When you first open up your MT4 trading platform, you will see the MT4 default layout with various windows that are open. This can be a bit confusing to a beginner and which is why, it is important to customize the chart area so that you feel comfortable and are not distracted by other instruments.
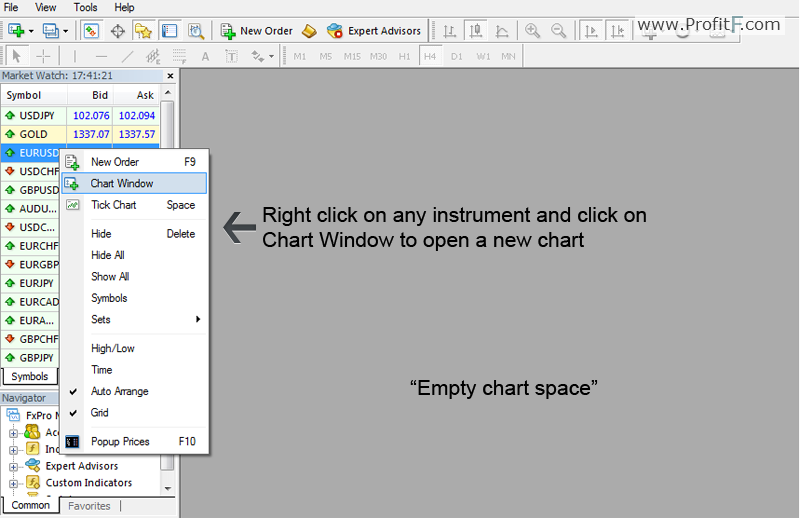
You can simply close all the windows by clicking on the ‘x’ on the top right corner. Once you delete these chart windows, you will see an empty space now. To open a new chart, right click on any of the instruments in the ‘Market Watch’ section in the left side and select ‘Chart Window’ to open up a new chart.
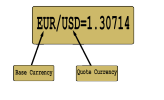
Once a new chart is opened, which in our case is the EURUSD chart; you can then customize it according to your preferences, which is covered in the next section.
The charts in MT4 offer a great level of customization which includes changing colors to adding studies as well switching between different time frames. In this section we’ll learn how to do all of that.
Chart Colors & Types
How to customize Chart Colors & Types
To customize the chart colors, right click anywhere on the chart and select ‘Properties’ from the menu. Alternatively, you can press F8 to bring up the ‘Properties’ window. In this window, you will see two tabs; Colors and Common.
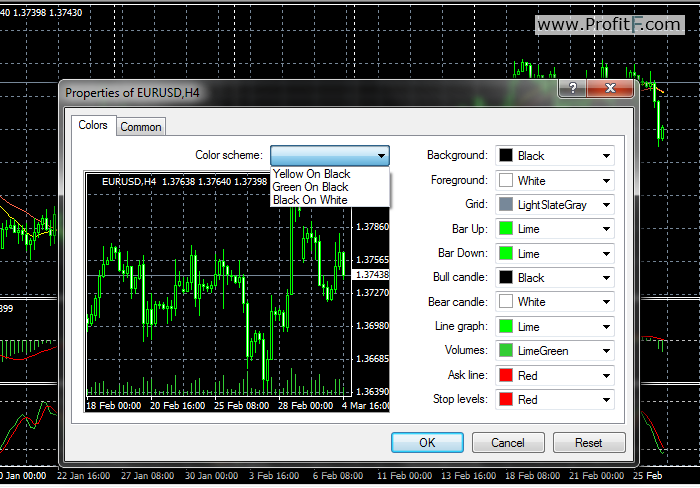
The Colors tab is used for changing the chart colors. You can select from any of the default colors or select a color scheme which offers three basic types of chart color scheme.
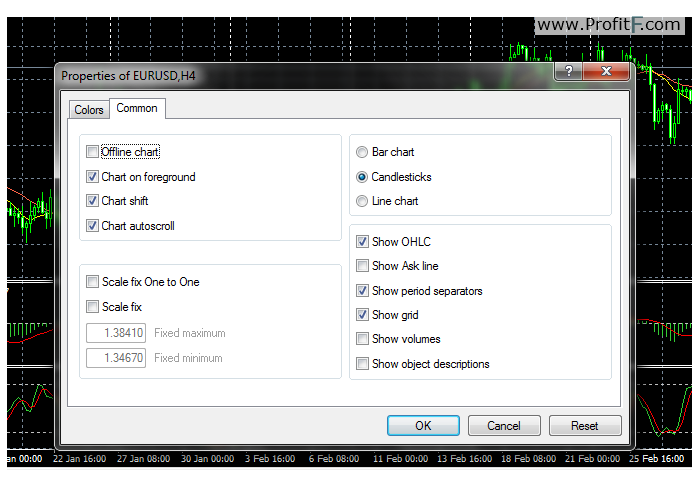
When you click on the ‘Common’ tab, you can change the chart configuration. In this tab, you can choose between Bar chart, Candlesticks or Line chart. Also, further customization can be done such as ‘Show OHLC’ which shows the current Open/High/Low/Close values and many more such features which are listed below:
TimeFrame (TF)
How to customize and switch between chart time frames
There are two ways to customize the timeframes. The first method is quite simple, where you just click on any of the time frames that you see in the tool bar, just above the chart.
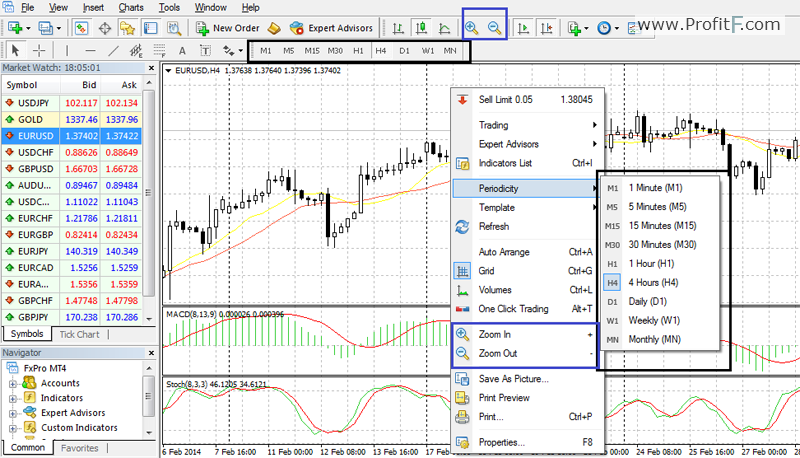
Alternatively, you can also switch between time frames by right-clicking on the chart and selecting ‘Periodicity’ and select any of the time frames that are shown. (From 1-minute charts to monthly charts.) To zoom in and out of the charts can be done by clicking on the +/- icons on the tool bar or by right-clicking on the chart and clicking on Zoom In or Zoom Out.
How to use chart indicators and drawing tools
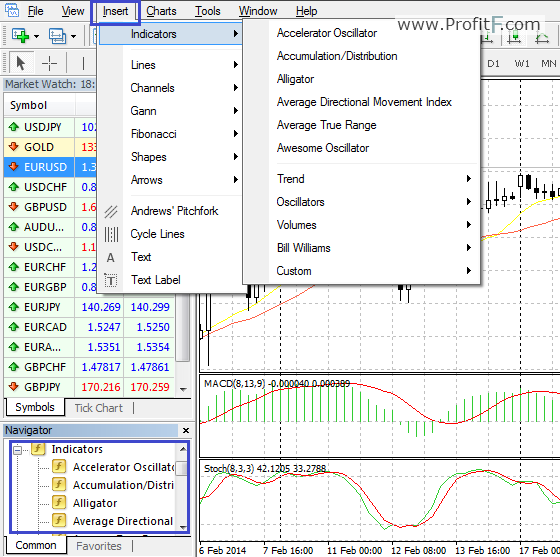
Now that you have an idea on how to customize the charts, in this section we’ll learn on how to add indicators and save the charts as templates. Indicators or studies to the chart can be added by clicking on the + sign in the ‘Indicators’ tab under navigator to expand the folder to view the default list of indicators offered by MT4. Another way to add indicators, is to click on ‘Insert’ from the main menu and then selecting the type of indicator or drawing tool that you want to use.
Adding Indicators: When you select an indicator, you will see a pop up window asking you to enter the indicator settings, which are usually set to a pre-set default settings.
Drawing Tools:
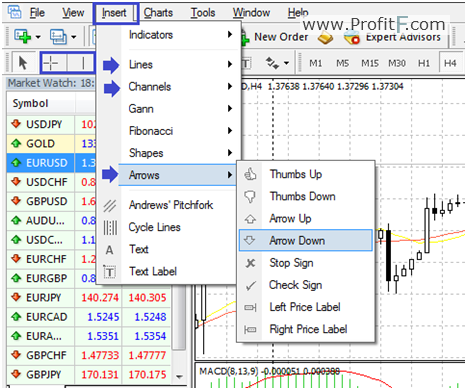
MT4 Chart Drawing Tools: To use the chart drawing tools, you can access them either via the default drawing tools in the toolbar or by clicking on Insert and selecting lines (to draw trend lines, vertical and horizontal lines, etc for example).
Save forex chart
How to save charts and create templates
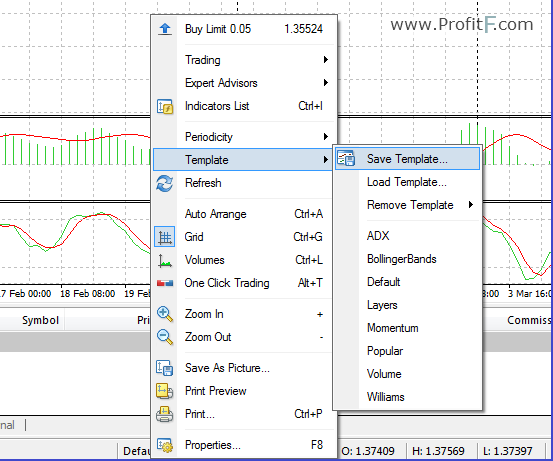
Now that you added all your custom indicators, it would be a pity if you had to do this all over again, every time you started your MT4. To avoid this, you can save your customizations. To do this, right click on your chart, select ‘Template>Save Template’ this will open a windows folder, asking you to enter the template name so you can use it for quick reference next time without having to manually enter all the indicators and settings for yourself.
As you can see, the above tutorial for customizing MT4 charts is very simple and easy. It is flexible enough to allow you to customize charts for any instrument and also to save the customizations so you can use it for quick reference for the future.
Final tips
MT4 Charts – Some final tips
1. Maximizing chart space: Double click on the shaded area shown on your MT4, to minimize the terminal screen and maximize the chart area
2. Quick navigation between charts: Access any open chart that you have by just clicking on the chart name
3. Chart window layouts: To switch between a full window or display multiple windows, click on ‘Window’ in the menu bar and select one of the options. Example, ‘Tile Horizontally’ will tile the windows, horizontally, one above the other. If you have too many chart windows, click on ‘Tile windows’ to have them formatted automatically.
4. You can close out the Market Watch and Navigator windows as well to maximize your charts.


 (19 votes, average: 4.11 out of 5)


Add your review