
Forex Divergence trading is both a concept and a trading strategy that is found in almost all markets. It is an age old concept that was developed by Charles Dow and mentioned in his Dow Tenets. Dow noticed that when the Dow Jones Industrials made new highs, the Dow Transportation Index tends to make new highs as well and when the Industrials index made new lows, the transportation index would also follow suit. This is because when industrial production is high, transportation is used more to ship the goods. During times of recession or slowdown, when production dropped, the transportation would also drop. (read more about DowTheory / Download free ebooks about Dow theory)
The most important of all is when Dow found out that when there was a divergence between the two, it presented a possible change in the markets. For example, when the Dow Industrials made new highs and when the transportation index failed to make a high it indicated that there was some discrepancy. This formed the basis of divergence theory which was soon developed into a trading system on its own.
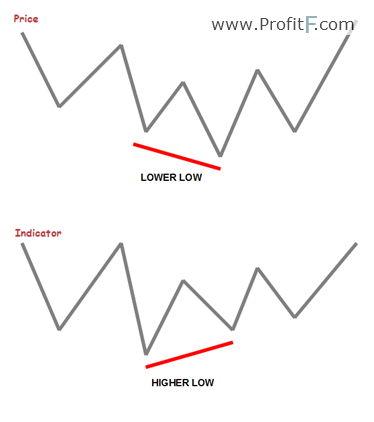
So, in the context of the forex markets, when price makes a new high, the oscillator also should make a new high. Or when prices make a new low, the oscillator should ideally make a new low. When there is a discrepancy between price and the oscillator a divergence is identified.
Indicators to use for Divergence Trading
To spot the divergences in the forex markets, it is usually done comparing price to an oscillator. The most commonly used oscillators include:
For the sake of clarity, in this article we will explain the concept of divergence trading using the RSI (14) Indicator.
Divergence trade setups can be spotted in any time frames and are classified into two main types.
The table below gives a brief summary of summary of various divergences and what they represent.
| Divergence | Price | Oscillator | Signal |
| Bearish Divergence | Higher High | Lower High | Sell |
| Bullish Divergence | Lower Low | Higher Low | Buy |
| Hidden Bearish Divergence | Lower High | Higher High | Sell |
| Hidden Bullish Divergence | Higher Low | Lower Low | Buy |
The charts below show how each of the divergences can be traded:
Bearish Divergence:
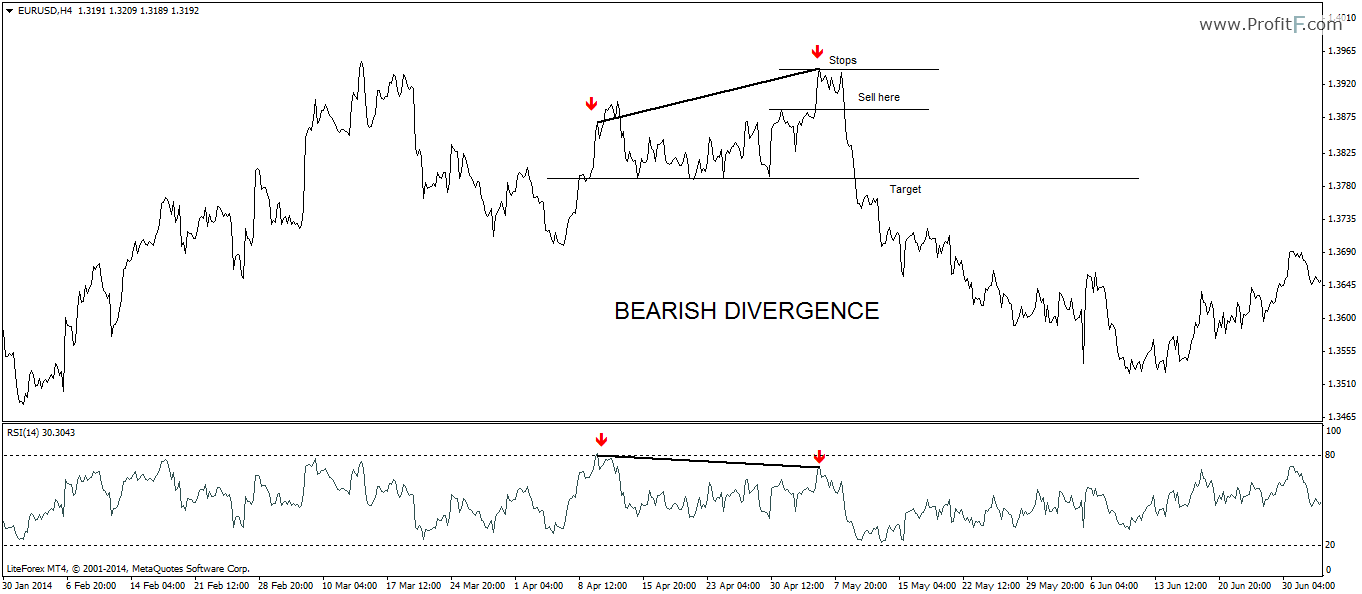
The bearish divergence is show in the above chart with price making a higher high but RSI making a lower high. A sell position at the small resistance prior to the high with stops at the recent high targeting the low formed during the divergence shows a high probability trade potential.
Bullish Divergence:
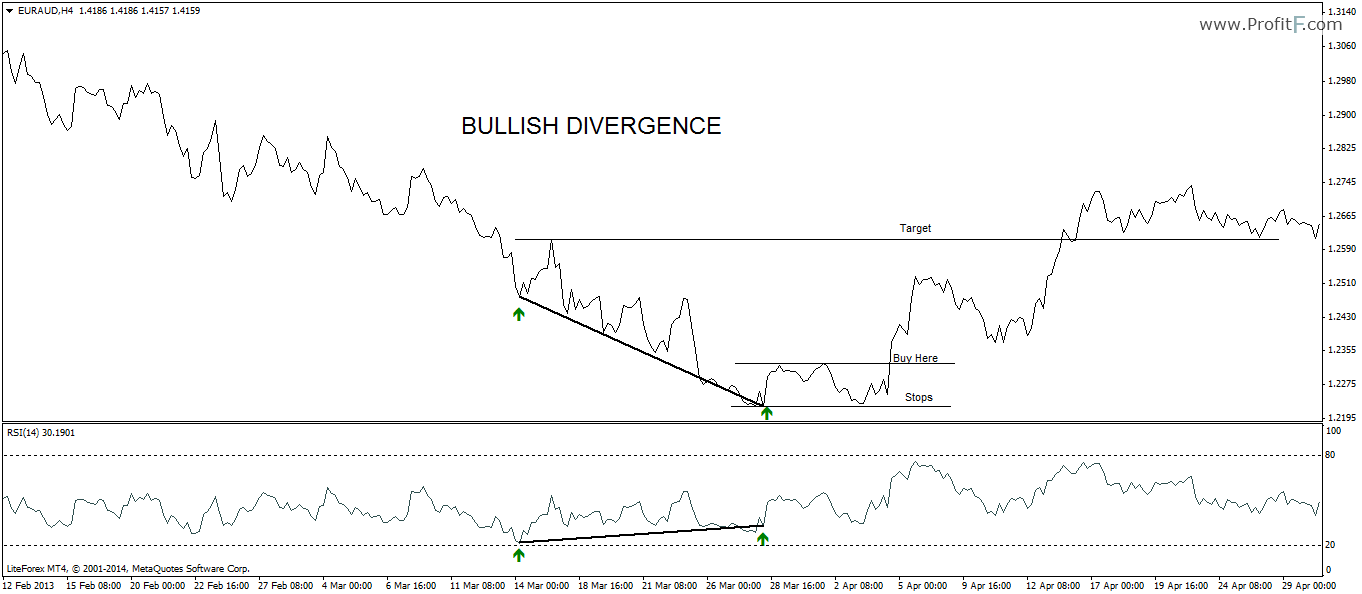
The bullish divergence chart above shows price making a lower low while the RSI makes a higher low. A long position can be entered at the top of the bounce after the second low is made with stops at or below the second low with target to the high formed during the divergence.
Hidden Bearish Divergence:
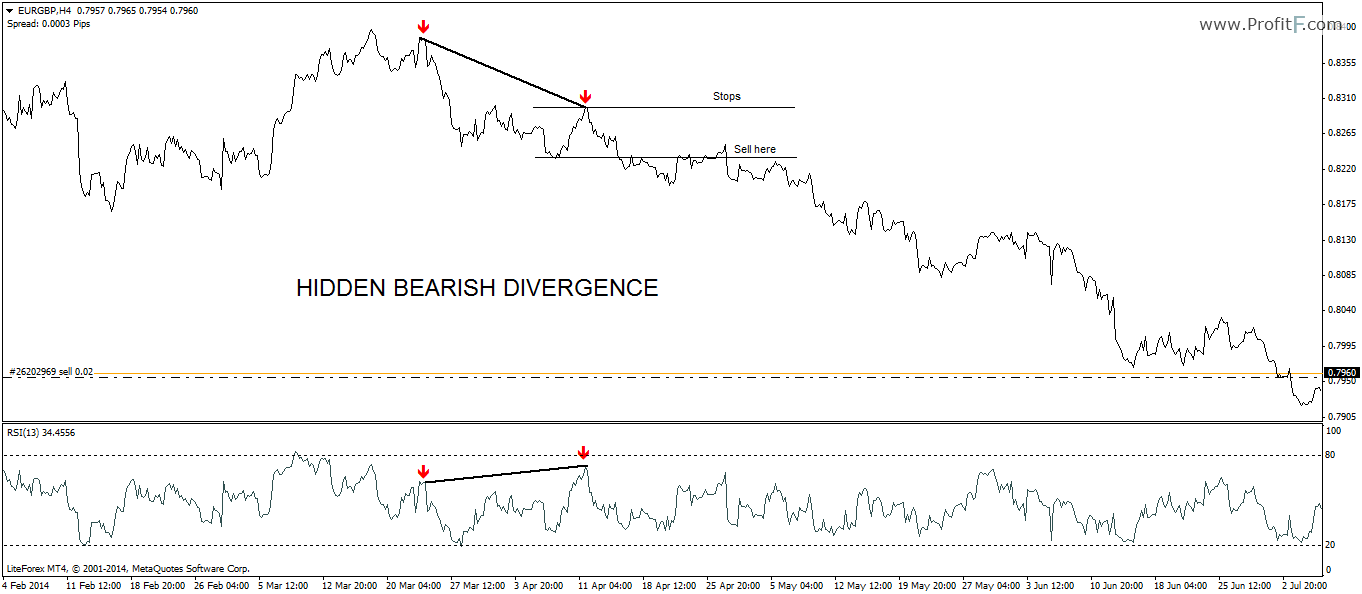
The above chart shows a hidden bearish divergence as price makes a lower high and RSI makes a higher high. The hidden bearish divergence occurs in a downtrend and signals continuation. Therefore, short positions can be taken on the low formed during the divergence to trade in the direction of the trend.
Hidden Bullish Divergence:
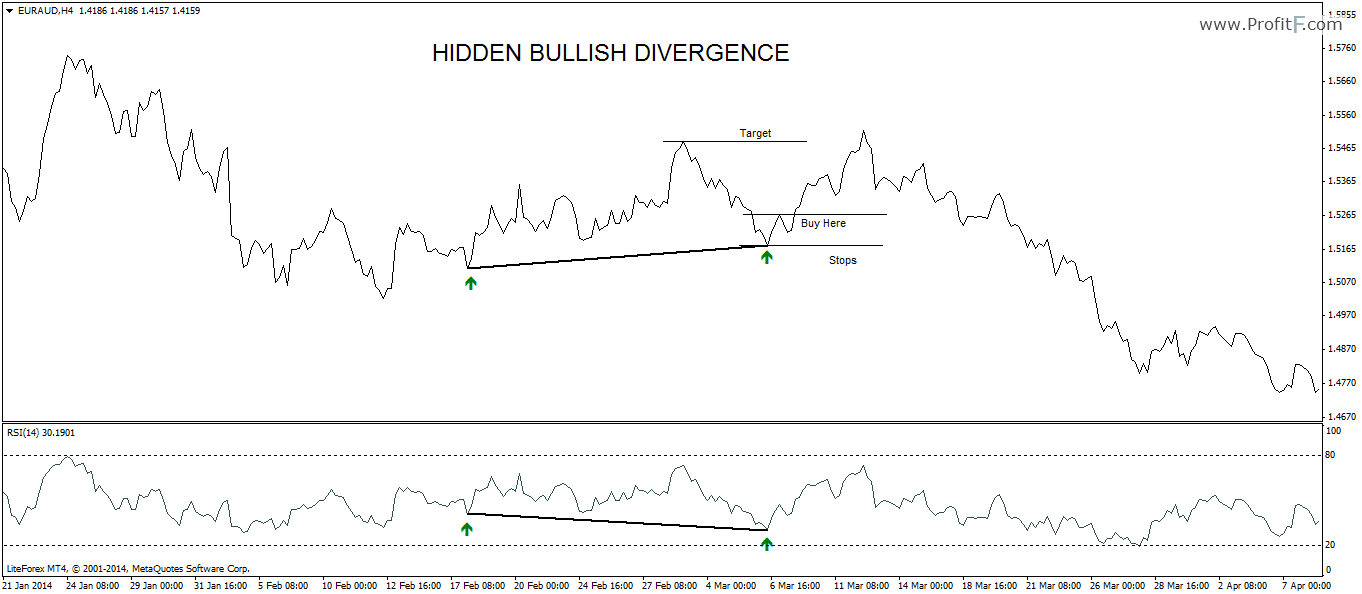
The chart above shows a hidden bullish divergence. Price makes a higher low, while the oscillator makes a lower low. Buying on the break of the previous minor rally with stops near or below the second low of price offers a good risk/reward trade, targeting the previous high that was formed.
Divergence Trading – Some important points
Divergence trading is easy and can be traded on any time frame. It can be used with MACD, RSI or any other oscillator for that matter. For best analysis in divergence trading, it is advised to make use of the line chart, especially when using the RSI and it is easier to spot the divergences. Candlesticks or bar charts are not ideal chart types to use with divergence trading due to the wicks. The lines chart represent closing prices, which is what RSI (or any other oscillator) tracks. Therefore line charts are better to identify divergence trading opportunities.
When trading with divergences, never take a position at the high or the low, but at the immediate support/resistance levels. In most cases, prices will continue to make another attempt to make a low or a high, which is usually done by the market to hunt for any stops placed by early traders who want to get more pips from their divergence trades.

 (31 votes, average: 4.35 out of 5)
Interesting, exact same situation with EUR NZD right now, let’s see how it turns out.