The euro is clearly in an uptrend/bullish correction, but is now facing major resistances on several crosses. Although there is no sign showing it is going to reverse yet, let us see where those resistances are to be ready to enter short should a reversal occur.
1-EURUSD trading plan
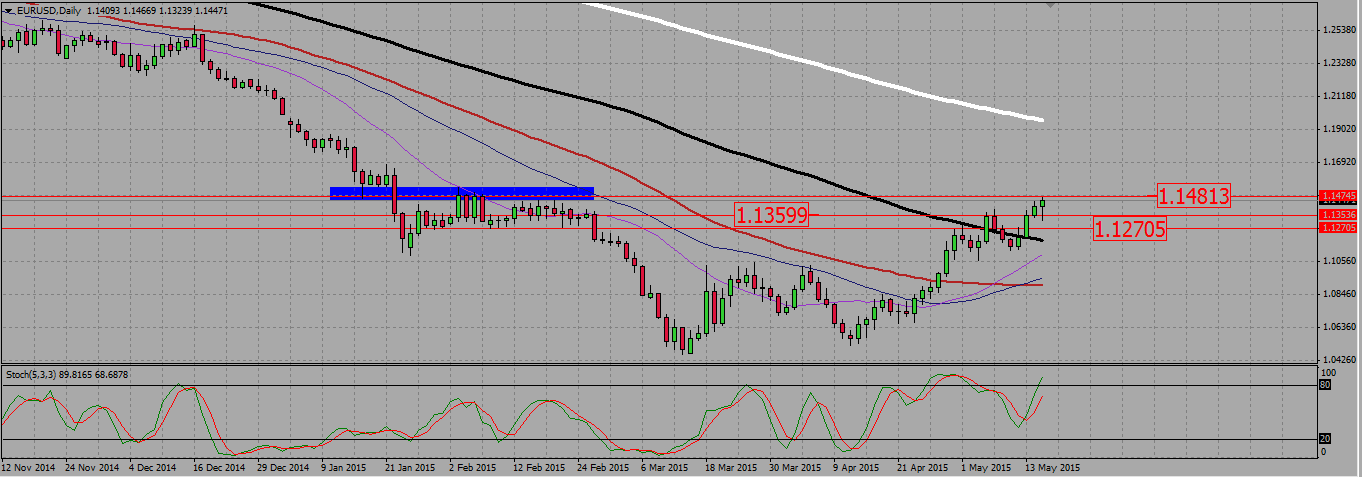
The pair is bullish but is facing a resistance level on the daily chart around 1,5. Should it reverse here, the supports/ take profit levels are at 1,135, and then 1,1275.
EURUSD DAILY CHART.
2-EURJPY trading plan.
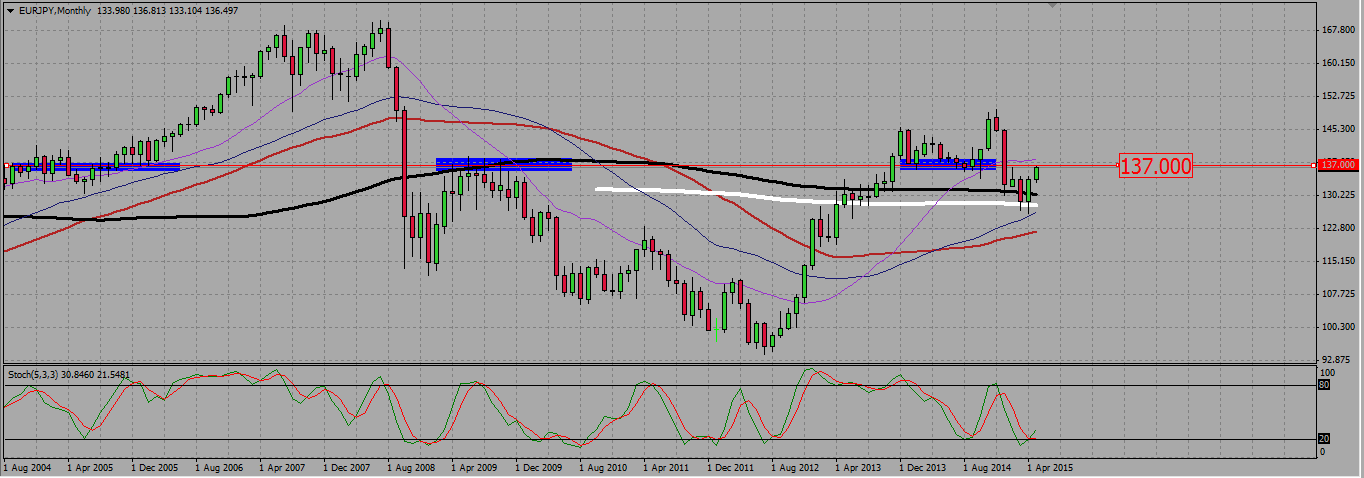
The pair is trading around 135,6 and is still looking bullish. There are however strong resistances between 136,5 and 137. Should it reverse, look for support/take profit level around 134 (on the daily chart).
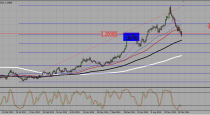
On the monthly chart we see 137 being a tough level to pass.
EURJPY MONTHLY CHART.
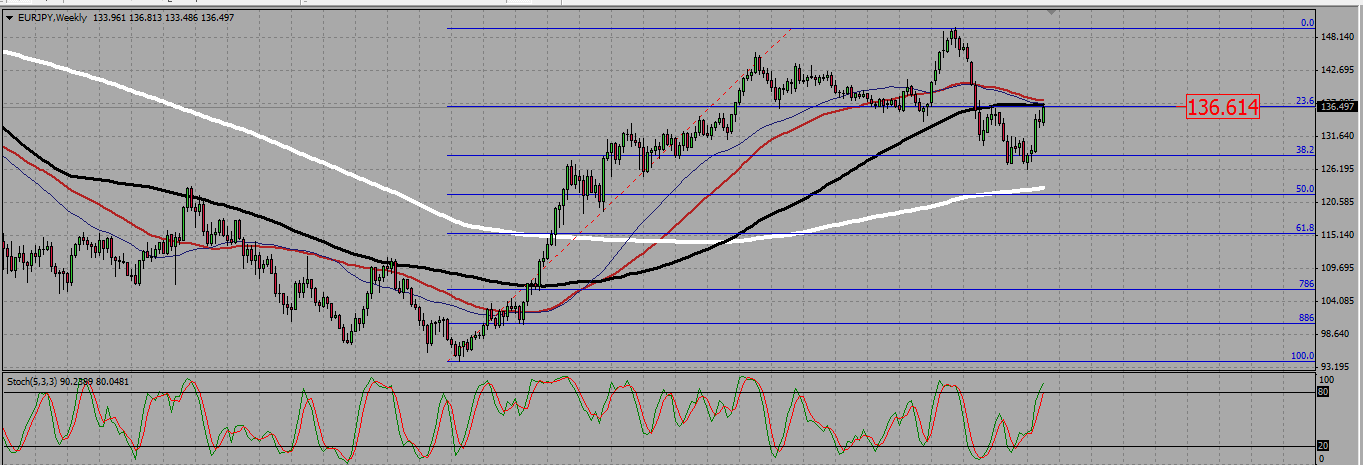
On the weekly chart, the pair is facing a 38,2 fib level and the 20,55 and 100 SMA resistance between 136,5 and 137.
EURJPY WEEKLY CHART.
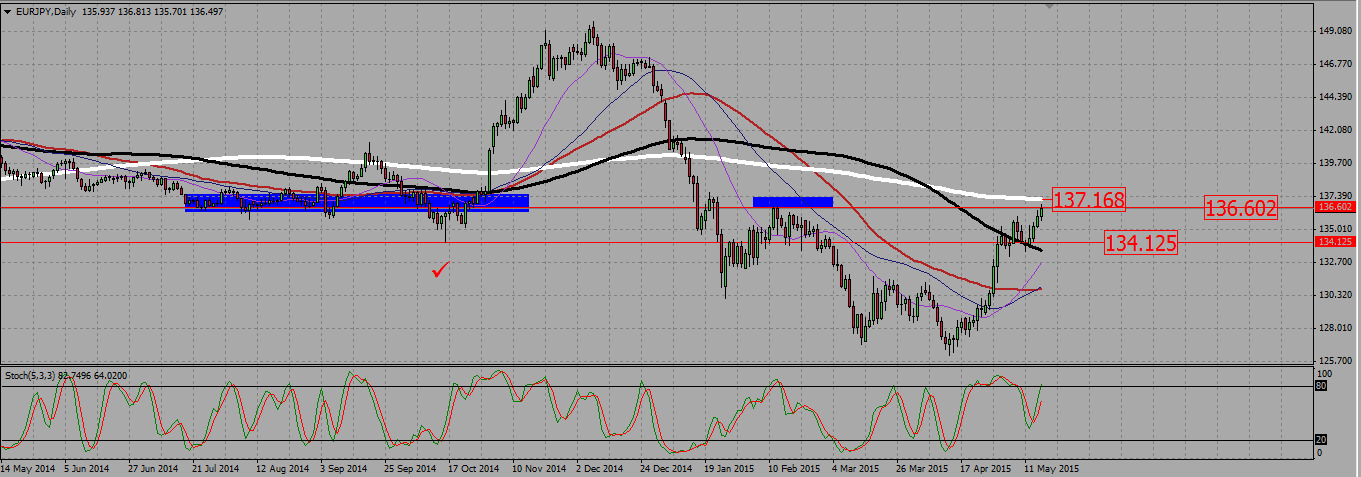
And on the daily chart we see the pair is up against a resistance/support level around 136,6. The 200 SMA is lurking just above.
EURJPY DAILY CHART.
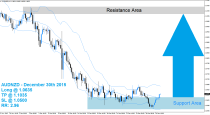
3-EURCAD trading plan.
EURCAD is trading around 1,375 and looks very bullish. There are however lots of resistances between that area and 1,386. Should it reverse, look for supports and take profit levels at 1,345 – 1,34.
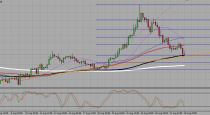
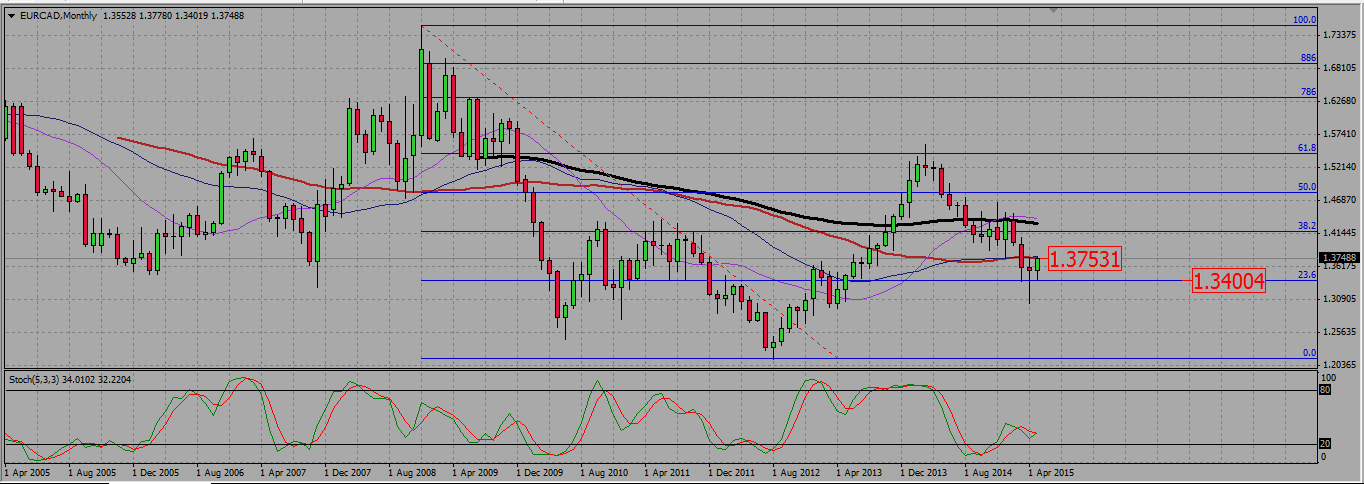
On the monthly chart we see the pair is facing both 40 and 55 SMA. It is bouncing from a fib support level around 1,34.
EURCAD MONHTLY CHART.
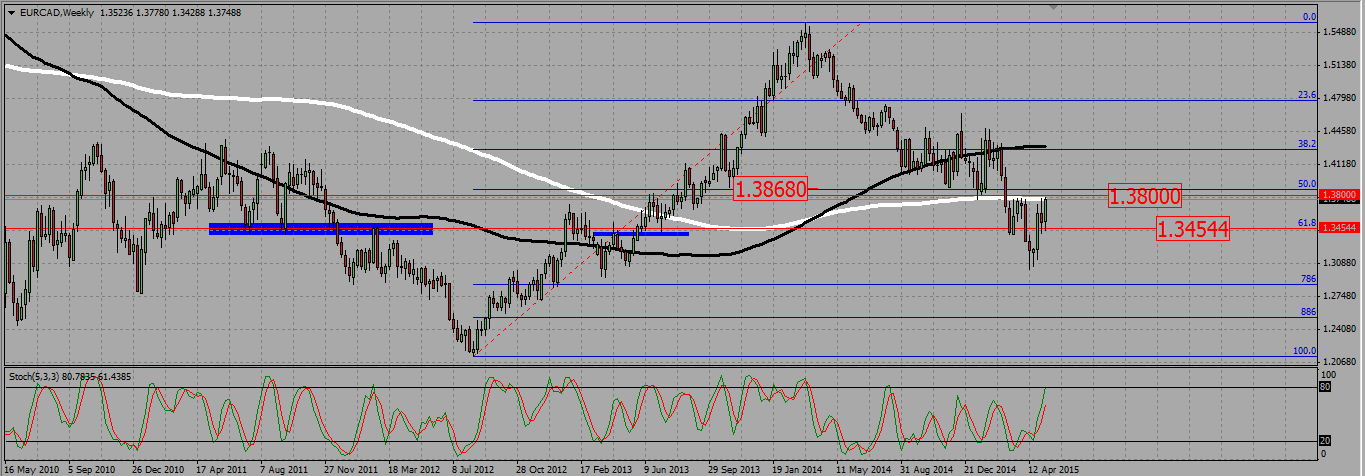
On the weekly chart, we see the 1,38 level is not thqt obvius to break. The 200 SMA is also located near that level, while a 50 fib line stands around 1,386. The first fib support, that we will use as our take profit level, is the 61,8 fib at 1,345.
EURCAD WEEKLY CHART.
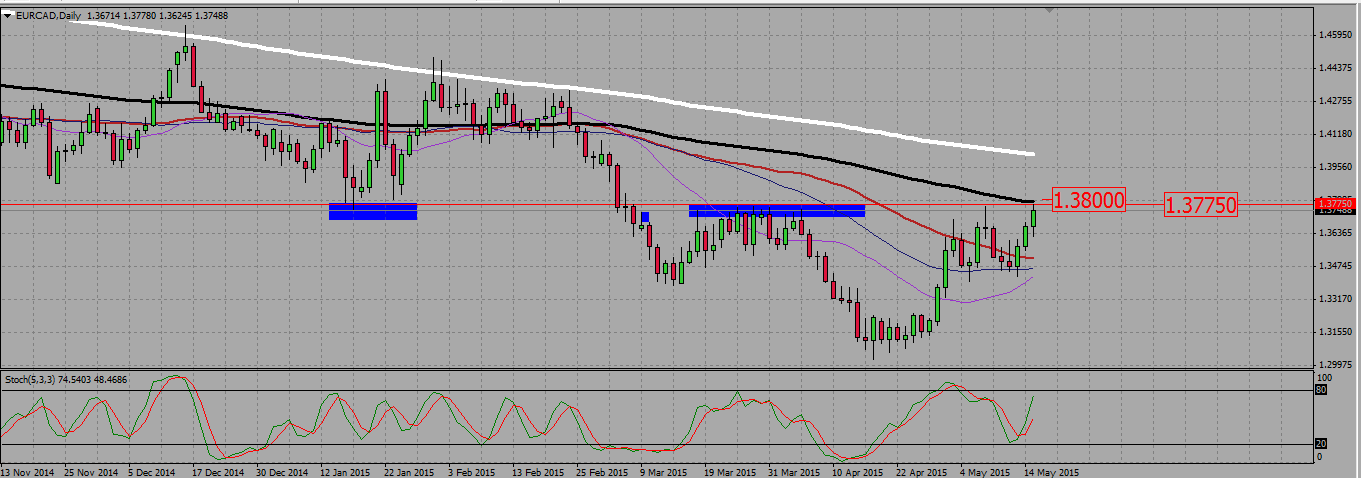
And on the daily we see the whole area 1,3775 – 1,38 to be quite hard to break up. The 100 SMA is also located there
EURCAD DAILY CHART.
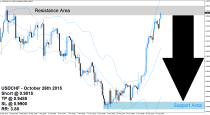
4-EURAUD TRADING PLAN.
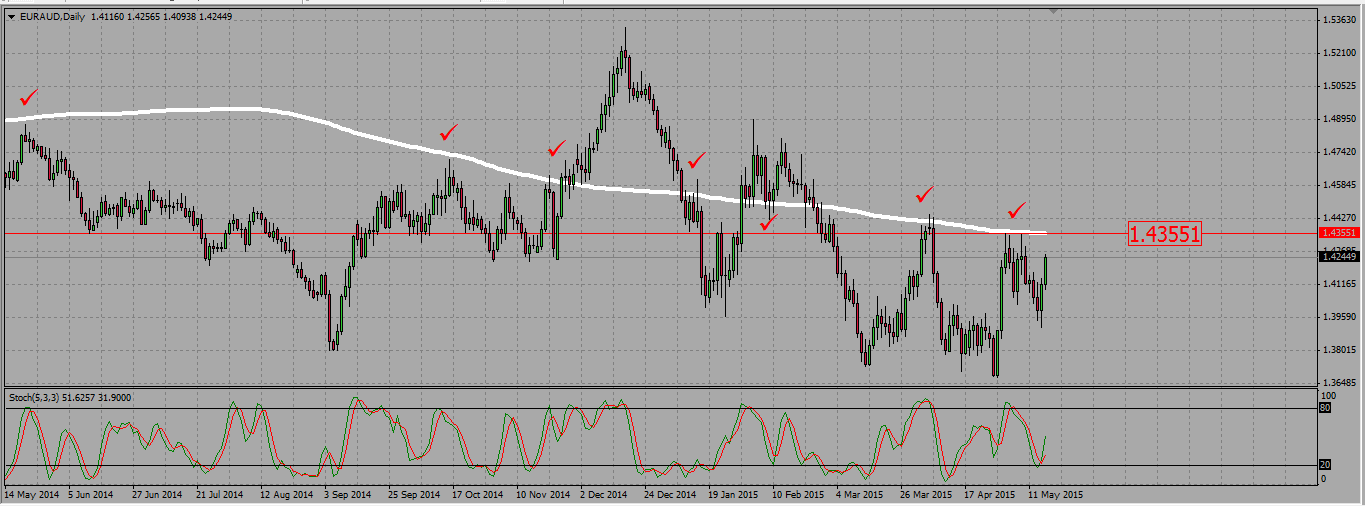
The EURAUD trades around 1,425. The daily chart shows it is reacting strongly to the 200 SMA, which is currently coming as a resistance around 1,435. This is where you should look for reversal, with take profit levels at 1,42 then 1,40.
EURAUD DAILY CHART.
 (No Ratings Yet)