
1-USDJPY trading plan.
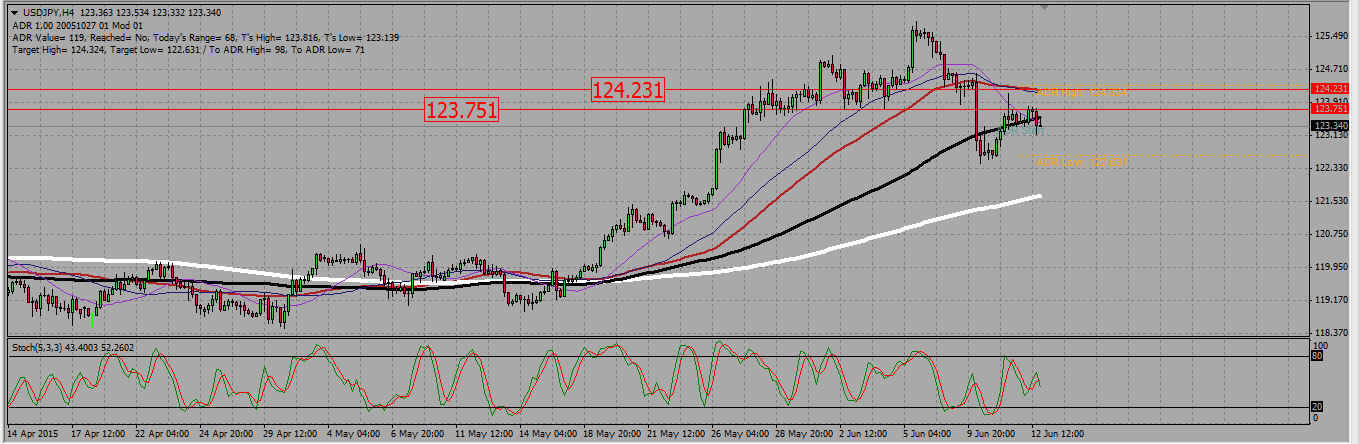
Look for selling signals up to 123,75, towards 123,0 and 122,3.
The yen reversed its bearish course after the BOJ’s governor made its point clear last week saying the yen weakness was not reflecting that currency proper market value. Following those declarations, the USDJPY broke down a support at 123,75, that means a level we did not want to see broken down in order to keep a bullish bias. Therefore we will now rather look to sell rallies under that 123,75 level.
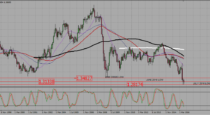
USDJPY H4 CHART.
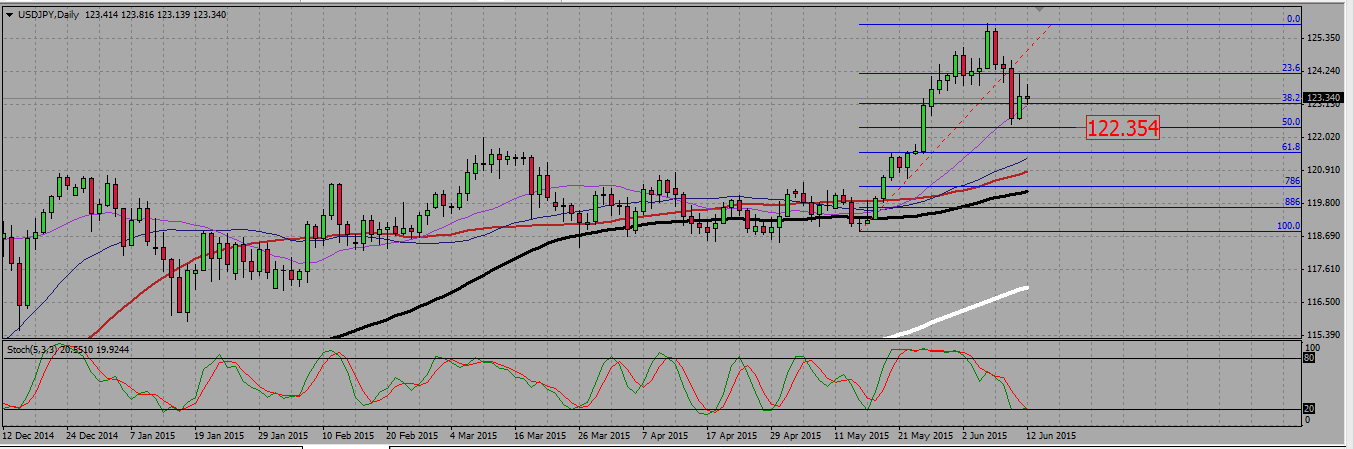
We may look to the daily chart to establish a take profit levels for our shorts. The first one will be the 38,2 fib level at 123, the second the 50 fib level support at 122,3. Please note how the pair is breaking down SMA100 on the daily chart, and how the 200 SMA is rising towards our second target level.
USDJPY DAILY CHART.
2-USDCAD trading plan.
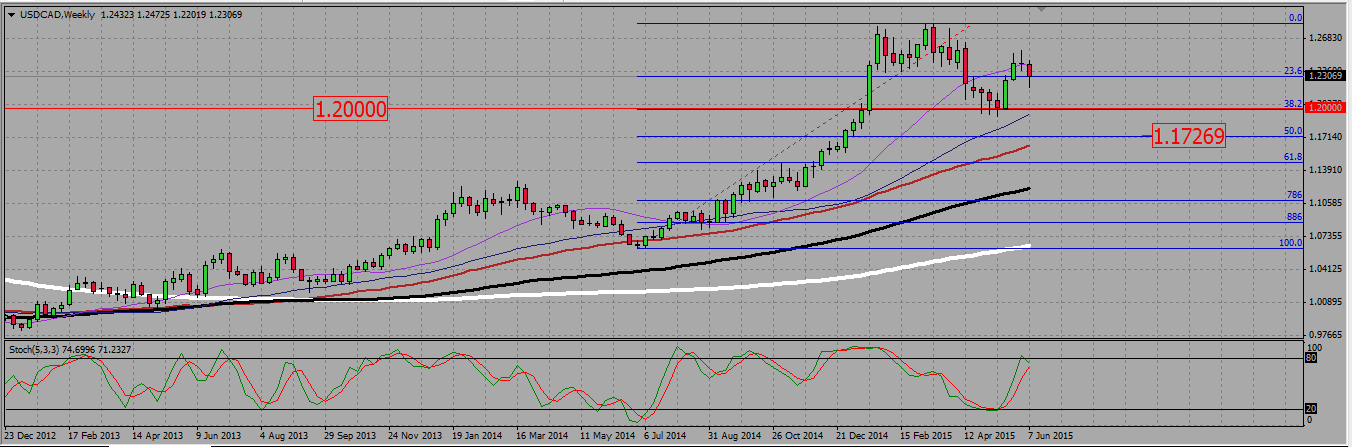
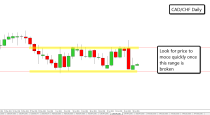
A bullish consolidation is under way. Keep a bearish bias under 124,25 with profit levels at 1,20 and 1,17.
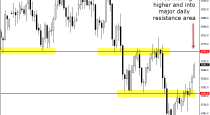
The daily chart shows us a sharp bearish move, followed by two mild bullish candles, both with an upwick. This probably means we are just consolidating. We may see ont two resistances on the chart : one at 1,235 was under retest on Friday, the second, stronger, is around 1,24 1,2425 with both an old range broken support and the daily 100 SMA. As long as we are under those resistances, we should be looking to sell rallies.
USDCAD DAILY CHART.

The weekly chart still shows us our take profit levels, merely the two fib support levels at 1,20 and 1,17.
USDCAD WEEKLY CHART.
3-NZDUSD trading plan.
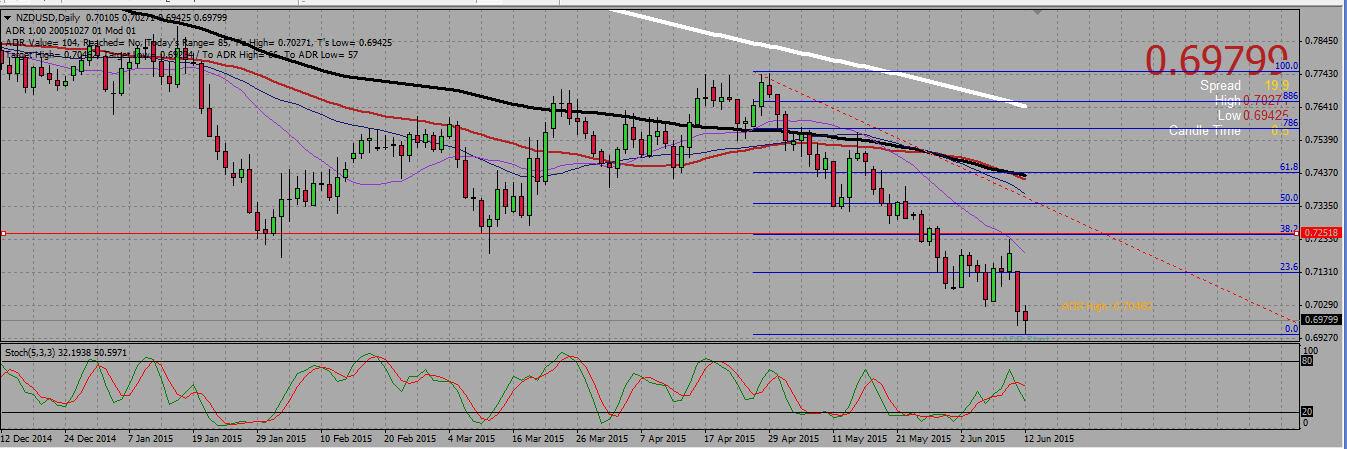
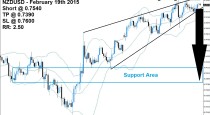
We are in a clear bearish trend, but expect a bullish consolidation to start the week, may be up to 0,725, allowing for some counter trend buying action. However, I will prefer to look for selling signals aiming at 0,69 and 0,67.
On the daily chart, we see a clear bearish trend, and we broke down the 0,70 level. The two last candles form a kind of morning star pattern, which suggests we may start to consolidate north, may be up to a clear resistance level around the 0,725 level.
NZDUZD DAILY CHART.
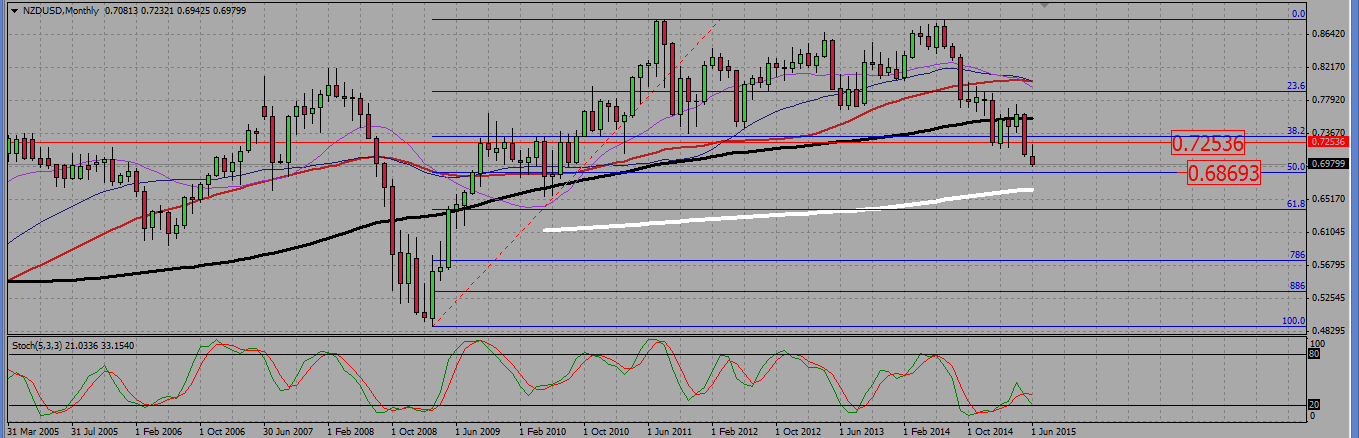
The monthly chart confirms the 0,725 resistance level and gives us two supports we may use as take profit levels for our shorts : 0,69 (a 50 fib level) and 0,67 (the 200 SMA).
NZDUSD MONTHLY CHART.
 (No Ratings Yet)
Add your review