The Harmonic Pattern CRAB is yet another discovery by Scott Carney and is identified by its long stretching swing points. In the crab pattern the PRZ level at swing/pivot point D is overstretched and shoots beyond the initial swing/pivot point of X. This is the main key difference between other harmonic patterns. The crab pattern, while easy to identify requires a bit of skill in trading the patterns, which is illustrated in the trade examples.
The Crab patterns structure is described in the following chart.
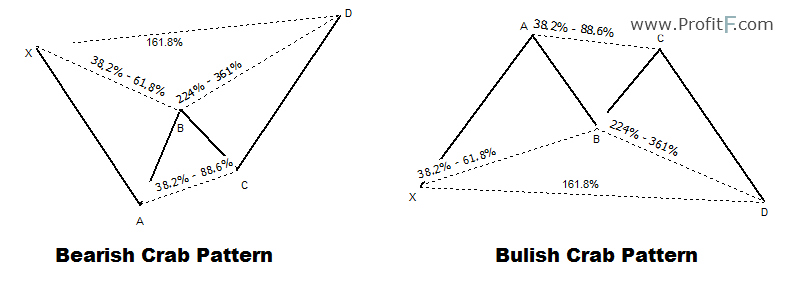
As we can see from the above structure of the Crab pattern, that while most of the swing points remain the same, it is the point D which is the main differentiating factor that sets apart the Harmonic Crab pattern from the rest of the patterns.
The key characteristics used to identify the Harmonic Crab pattern are as follows::
Unlike other harmonic patterns, the crab pattern when formed can be very volatile. There are no fixed stop loss levels and therefore a bit of subjectivity is required. Traders usually wait for a high and a low to be formed before placing their stops at or above/below these reversal levels.
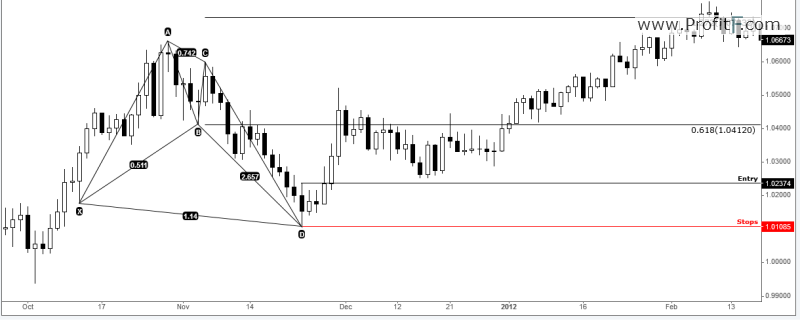
The above chart shows a real time trading example of the Bullish crab pattern. It is easily identified by the swing point D, which clearly overextended below the previous swing point X.
After the pattern is identified, a long position would be taken near the high of the point D. Another way to confirm the trade entry is to look for possible bullish candlestick price action. In the above case, we can see an outside bar being formed followed by a bullish candle to the upside. Entering the trade at the high of the candle formed at D with stops at the low of D gives a tight stop loss level.
The targets are then set to 61.8% of the CD leg followed the second target at 127.2% of the CD leg.
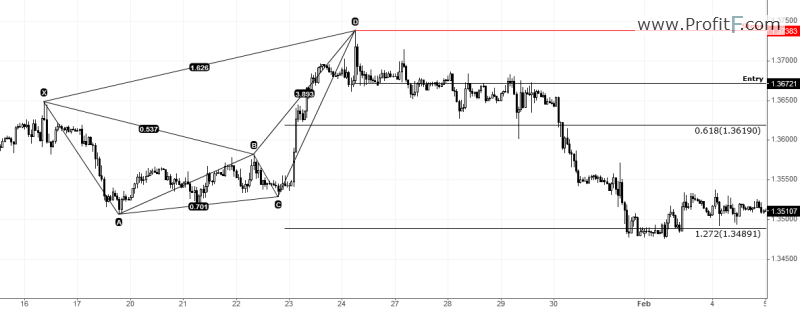
The bearish Crab pattern example in the above chart shows how price reacts near the PRZ level of swing/pivot point D. In the above example, AB retraces to 53.7% of the XA leg and then declines towards 70.1% of AB leg. Price then rallies from C form the CD leg which is an extension of 162.6% of XA leg and 389.3% of AB leg.
An observation from the above bearish Crab pattern does not meet the Fib levels to the dot. However the overall price action and structure makes it a qualified bearish crab.
After identifying the crab pattern, a short position is taken at the low of the price at swing/pivot point D with stops at the high. The targets are 61.8% and 127.2% of the CD leg, which price manages to reach.
One of the shortcomings of the Crab pattern is that it is a bit complex. Combine this with the fact that the stop loss levels needs to be adjusted can mean that traders will view the stop levels differently. The harmonic crab pattern is best to use along with other trading methods, especially horizontal support/resistance as well as trend lines.
Some traders also prefer to make use of oscillators to confirm the bearish momentum especially when price is trading the PRZ swing point D.

 (16 votes, average: 4.25 out of 5)