
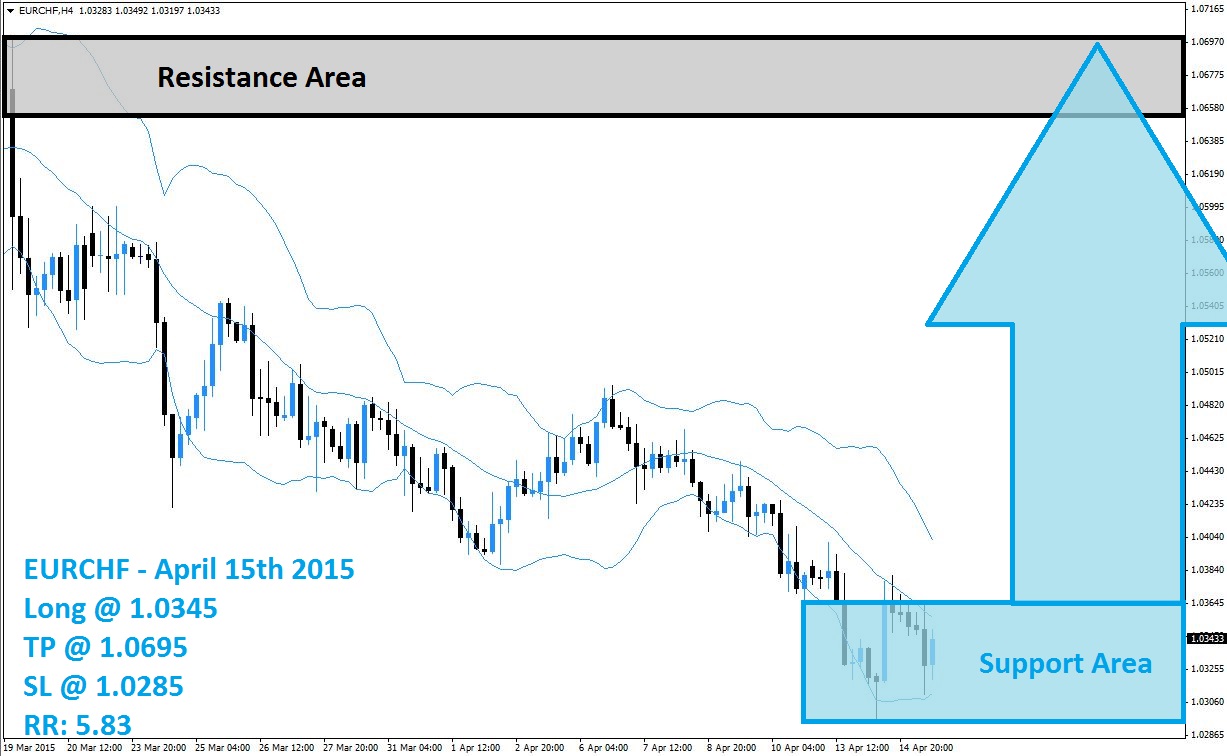
The EURCHF has embarked on a sell-off after failing to breakout above its resistance area which is visible in light grey in the above H4 chart. A sharp HF candlestick initiated the breakdown below its resistance area and from this point the middle band of the Bollinger Band indicator prevented a move above it and assisted the sell-off. At the beginning of the month forex traders enjoyed a relieve rally which took the EURCHF into the upper band of its Bollinger Band indicator.
Momentum was not strong enough to result in a breakout above the upper band and forex traders quickly switched gears. Profit taking merged with the addition of new sell orders and after the EURCHF dropped back below the middle band the sell-off accelerated and this currency pair dropped to its new support area, visible in light blue in the above H4 chart. The lower band started to trend sideways which indicates that the selling may have reached its climax and will start to recede over the next few trading sessions.
Forex traders should position their trading portfolios for a short-covering rally which is expected to take place as the EURCHF trades in oversold territory. Long positions at 1.0345 or below are recommended with a take profit target of 1.0695 for a potential trading profit of 350 pips on the H4 Chart. Watch out for a breakout above the support area which is likely to fuel a short-covering rally and further advance this currency pair into its resistance area.
Forex traders should protect this trade with a stop loss level at 1.0285 for a potential trading loss of 60 pips which will result in a Risk-Reward (RR) ratio of 5.83.
EURCHF
Long @ 1.0345
TP @ 1.0695
SL @ 1.0285
RR: 5.83
 (No Ratings Yet)
Add your review