
1-EURUSD trading plan.
Sell bearish break out of 1,108. Buy confirmed bullish break out of 1,128.
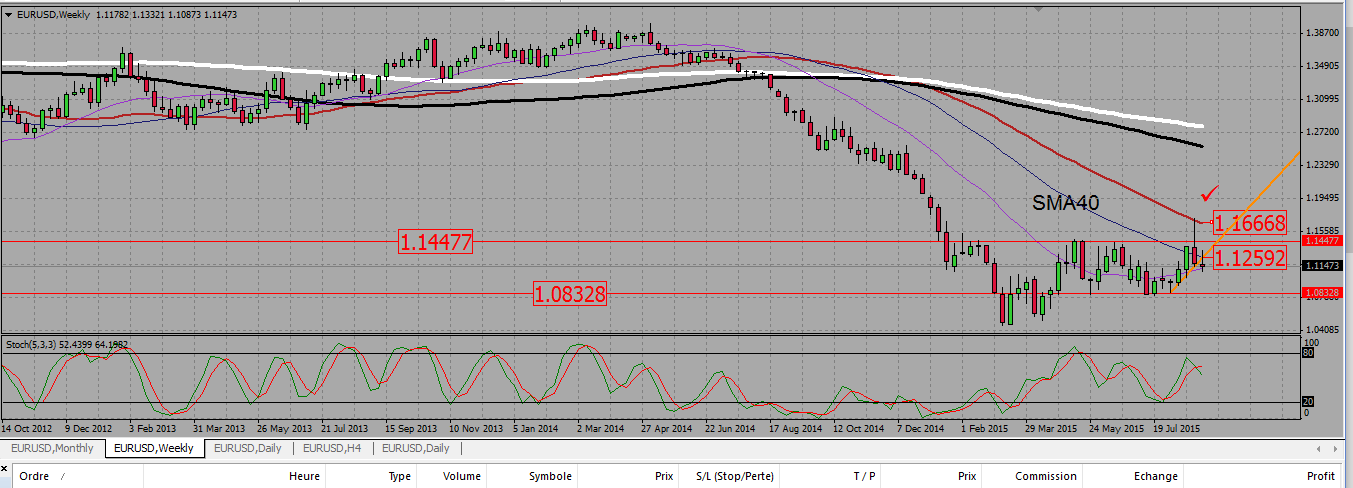
On the weekly chart, the pair is ranging between an horizontal support line around 1,08 and a resistance around 1,145. There was a false break out of the resistance at 1,145 two weeks ago, but right after the eurodollar has been capped by the weekly 55 SMA resistance around 1,165, and it felt back in the range. In the process, the pair managed to break down a support trend line, but the last candle is an indecision candle, meaning we may go either way. Please take note of the SMA40, located around 1,125.
EURUSD WEEKLY CHART.
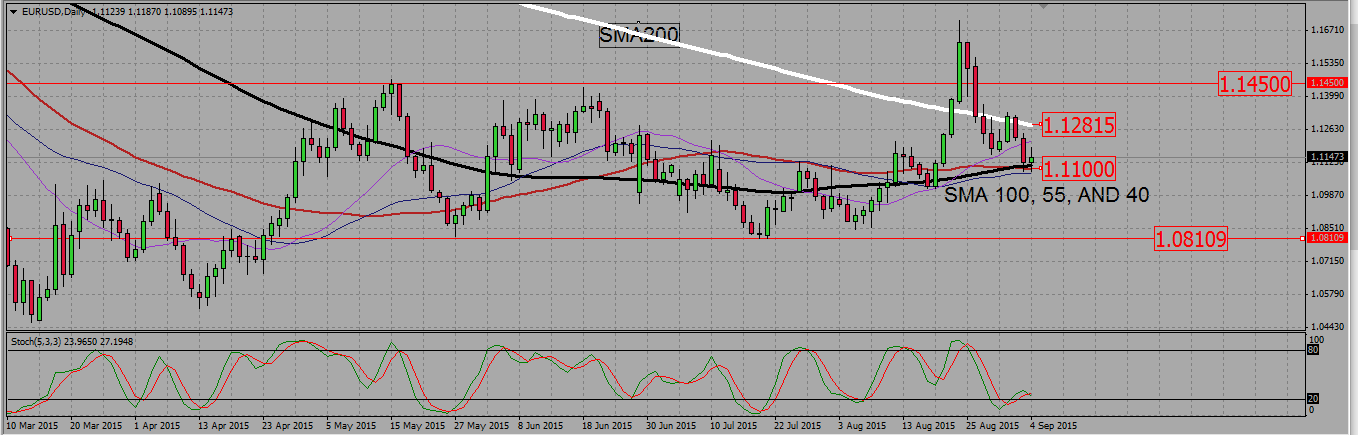
On the daily chart, we see that after re entering the range, the pair struggled a little bit with the 200 SMA support around 1,128, before breaking it down. That 200 SMA is now a resistance and I will look to buy above it towards the 1,145 range level. There is a strong confluence of SMAs around 1,11 with three of them (100,55,40) acting as supports. I will sell under that zone to go to the range support around 1,08.
EURUSD DAILY CHART.
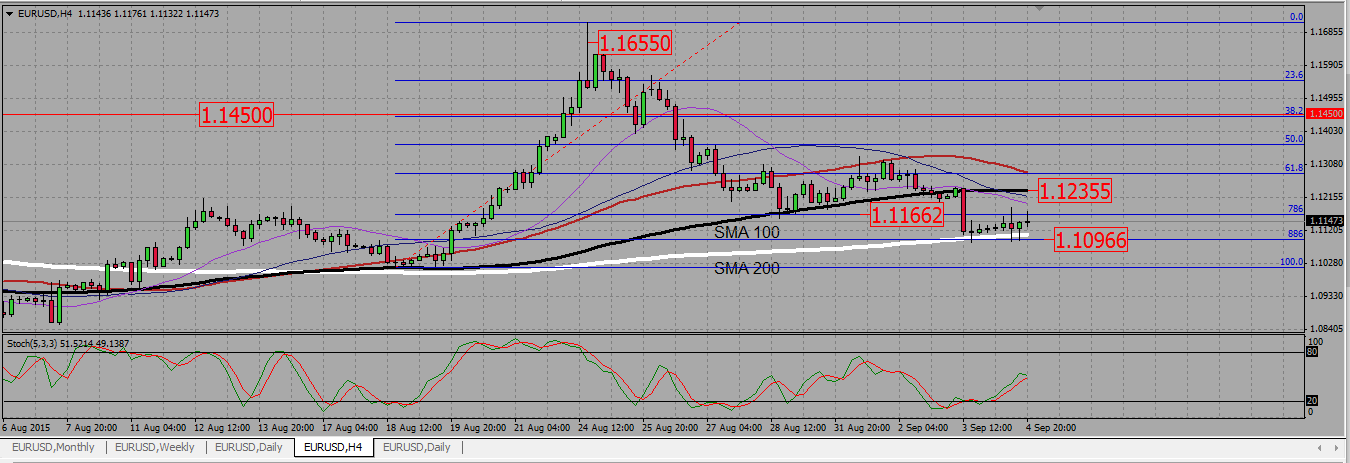
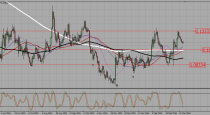
The H4 chart will help with better defining support and resistance levels for that pair. After we failed at breaking the 1,165 level, the EURUSD went down and re entered the range at 1,145. That level will be my first profit level for a long trade. If it is broken, it will become a support where I will look for buying signals. On the opposite, if it is tested and rejected as a resistance, I will enter short to go back to 1,08.
After breaking down that 1,145 level, the pair ranged a little bit above the 100 SMA support before breaking it down. That SMA is currently located at 1,123, and became another resistance where I may look for selling signals. Should it be broken, I will however wait for the pair to reach 1,145 to start thinking about buying.
Finally the pair is now stalling above the 200 SMA support around 1,11, where a 0,886 fib line is also located. This is the place where the daily 100,55, and 40 SMA are located. It is therefore a strong support. Should it break, I will enter short with my take profit at the range support line (1,08). I will be very reluctant to buy that level, because there is too many resistances above, and we did broke a support trend line on the weekly chart.
EURUSD H4 CHART.
2-AUDUSD trading plan.
Sell signals under 0,71 towards 0,66. Buy signal at 0,66 to go back towards 0,71 and above that towards 0,725 and 0,76
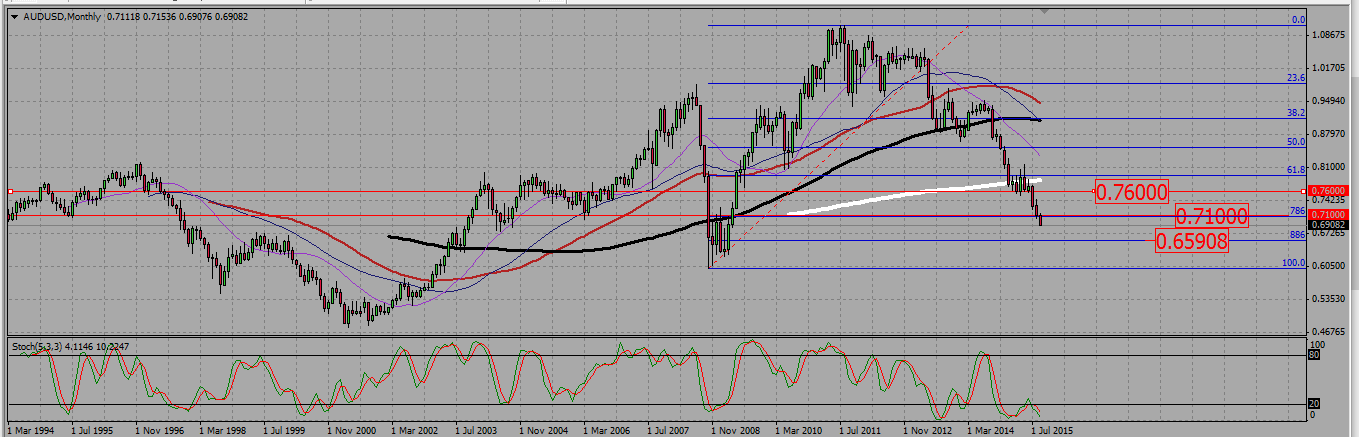
The aussie looks very bearish. On the monthly chart is has just broken a 0,776 support fib line around 0,71, it broke the 0,70 psychological level, and seems to be rushing towards the next fib line, namely the 0,886 around 0,66. As this line is usually a strong support, I will look for buying signals at that level should we get there, to go back to 0,71, and above to 0,725 and 0,76.
AUDUSD MONTHLY CHART.
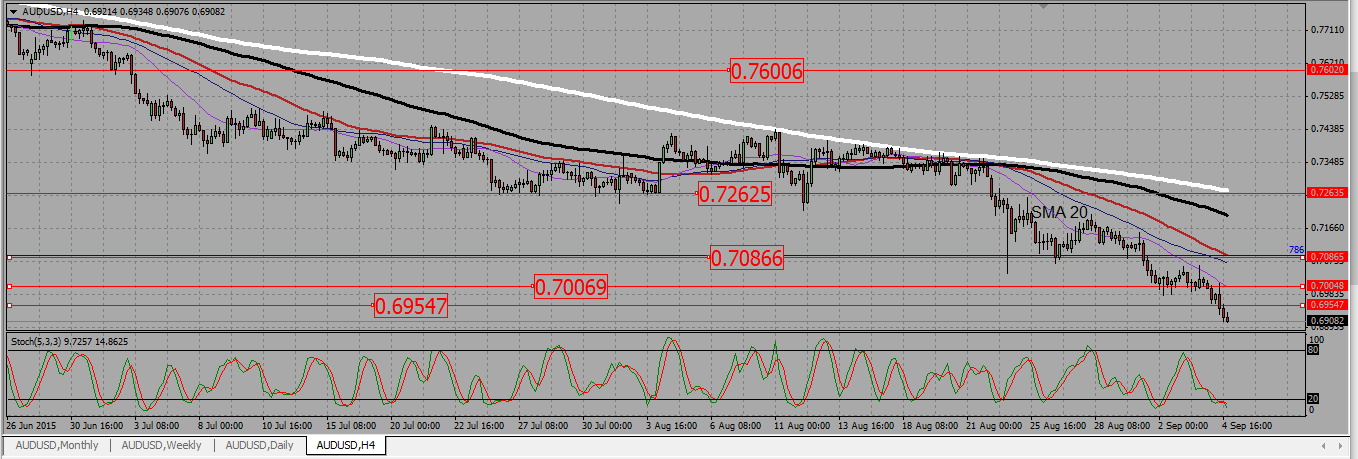
We need however to remember that pair shows bullish stochastic divergences on many charts. This is why I will wait for a pull back to a resistance and a sell signal on H4 to enter in a trade. On the H4 chart, those levels are located at 0,695, 0,70, and 0,71. The H4 20 SMA also seems to act as a resistance, and a bounce from it would be for me a valid sell signal.
AUDUSD H4 CHART.
 (No Ratings Yet)
Add your review