
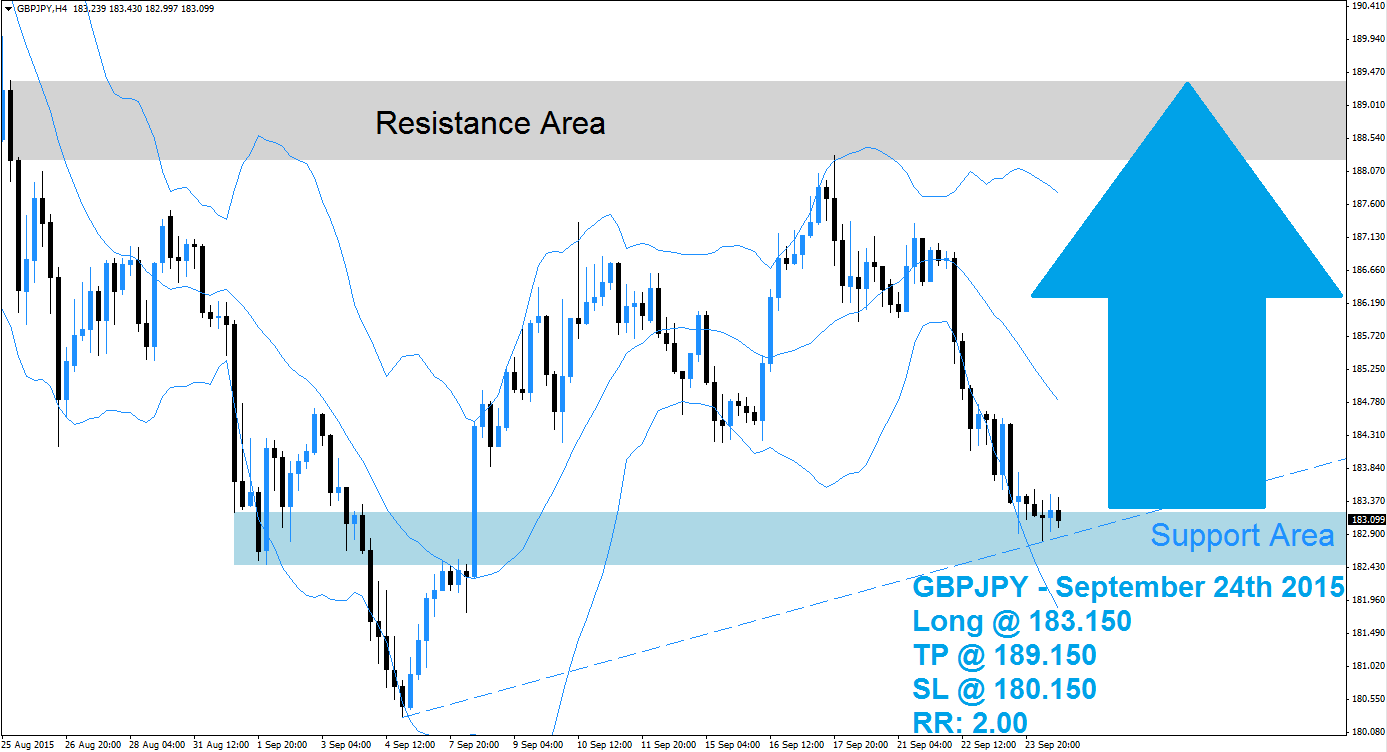
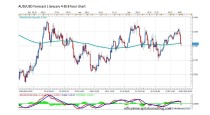
The GBPJPY enter a sell-off after touching its resistance area, visible in light grey in the above H4 chart, and how now reached its support area which is marked in light blue. The support are is also being crossed by an ascending support level from a previous false breakdown which led to a strong price action reversal on the back of a short-covering rally. This currency pair is now trading at a crucial support level from where another short-covering rally is expected.
Forex traders may want to take the ascending support level crossing the support area as a solid sign to realize floating trading profits once again and initiate a short-covering rally which will reverse the sell-off. All three bands of the Bollinger Band indicator are sloping to the downside as the lower band also crossed below the support area. The GBPJPY is trading between the lower band and the middle band, inside of its support area and at its ascending support level.
Forex traders are recommended to seek long positions at 183.150 and below this level which will position their trading portfolio to profit from the expected short-covering rally. Conservative forex traders should wait for a breakout above the middle band of it Bollinger Band indicator before entering their long positions. A take profit target of 189.150 has been set for a potential trading profit of 600pips on the H4 Chart. More buy orders are expected after the GBPJPY completes its breakout above the middle Bollinger Band.
Forex traders should protect this trade with a stop loss level at 180.150 for a potential trading loss of 300pips which will result in a Risk-Reward (RR) ratio of 2.00.
GBPJPY
Long @ 183.150
TP @ 189.150
SL @ 180.150
RR: 2.00
 (No Ratings Yet)
Add your review