
EURUSD trading plan.
The pair is consolidating within a bullish triangle. There is a support inside it, around 1,115, where I will look for long signals. Otherwise I will wait for the pair to exit that triangle to take a position.
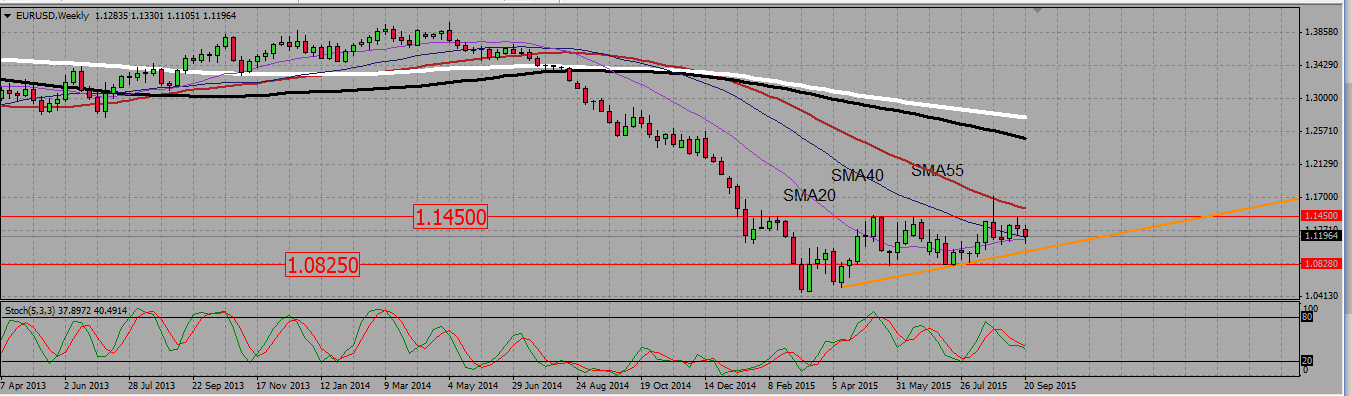
On the weekly chart, we see the pair ranging and consolidating within a bullish triangle. The last candle is a bearish pin bar, with a long downwick. It is supported by both 20 and 40 SMAs around 1,117. The 20 SMA begins to point up.
EURUSD WEEKLY CHART.
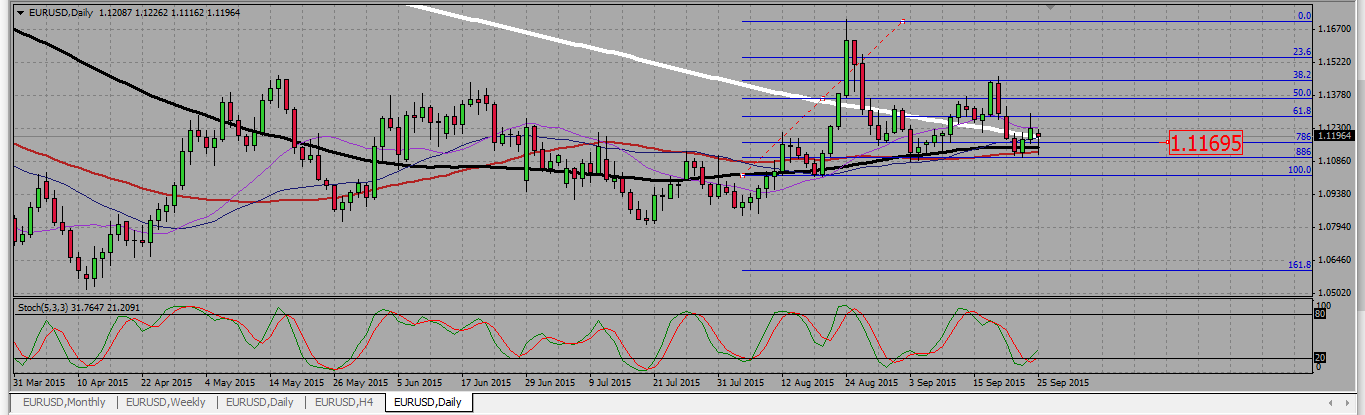
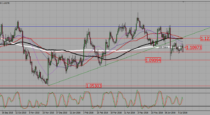
On the daily, we clearly see a support around 1,115. Five important SMAs (200,100,55,40,20) are located there. Except the 200 SMA, all others are starting to point up, meaning the pair is slowly rising. This is why i will check any pullback to those levels -around 1,115- to look for buying signals there. Otherwise I will wait for the pair to exit from or bounce back within the triangle to open a position.
EURUSD DAILY CHART (1).

Another clue on the daily chart is a daily fibo retracement. The pair has reversed near the 0,886 fibo support and broke up the 0,786 around 1,116, adding to the strength of that zone as a support.
EURUSD DAILY CHART (2).
USDCAD Trading plan.
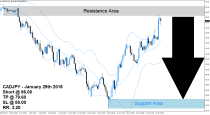
The pair is retesting a very strong resistance, but it seems wishing to go higher. Sell bearish reversals or buy confirmed break out of the 1,335 high.
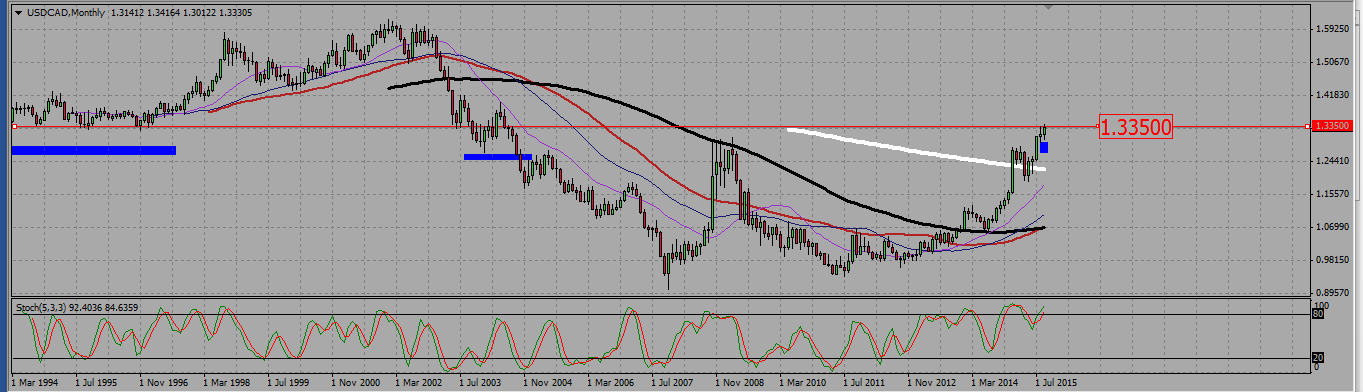
On the monthly chart, we see the 1,335 level, currently being tested as a resistance, was tested 24 times over the last 20 years. It held 20 times, and was broken only 4 times. Statistics says it should rather hold.
USDCAD MONTHLY CHART.
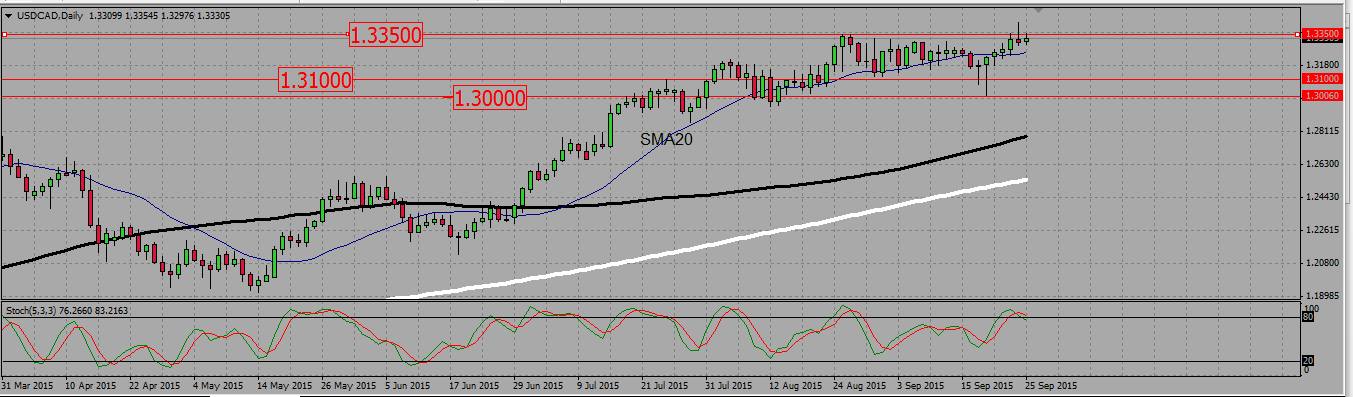
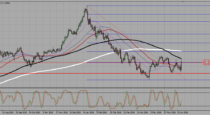
On the daily chart, the pair is not clearly reversing from that 1,355 level, but rather mildly consolidating under it. A previous trial at sending it lower failed and even gave two strong bullish pin bars, rejecting supports at 1,31 and 1,30; clearly that pair is still fighting to go higher. However, Thursday candle was a shooting star, followed by a weak bullish candle on Friday.
This is why I am rather looking to short that pair. A bearish break out of the 20 daily SMA would be a strong signal USDCAD is starting to go down. But as it is not clearly reversing yet, I am also ready to by a confirmed bullish break out of the 1,335 resistance.
USDCAD DAILY CHART.
 (No Ratings Yet)
Add your review