
Subscribe to Updates (Weekly forex analysis by Stephen L) via Email
USDJPY trading plan
There is a fierce battle between the bulls and the bears around 101 -100. Watch price action there, but I will favor buying signals above 99 towards 105. I will however sell confirmed -with a break down pull back confirmation -signals at 100 or 99.
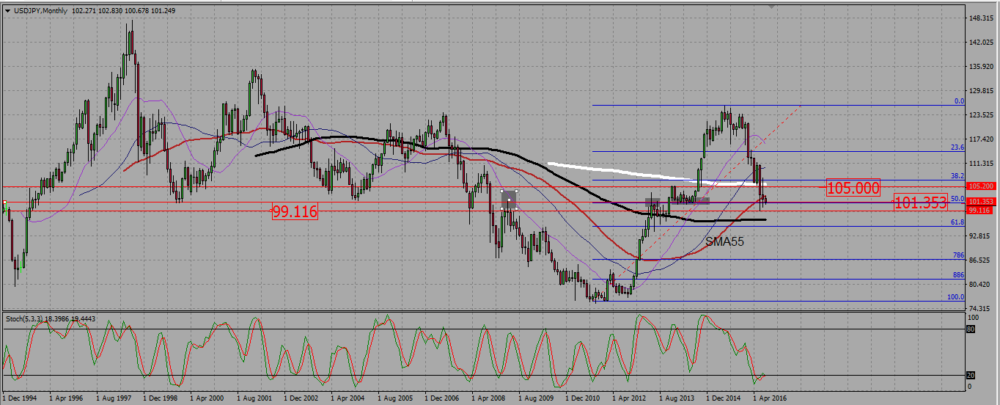
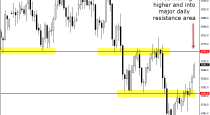
On the monthly chart, the pair has been in a bearish consolidation mode since July 2015. It is now reaching a 50 Fibonacci support level. The chart shows a strong resistance/support zone at those levels, and this why I would rather buy it here. Please take note the 99 level which is also a support.
USDJPY MONTHLY CHART.
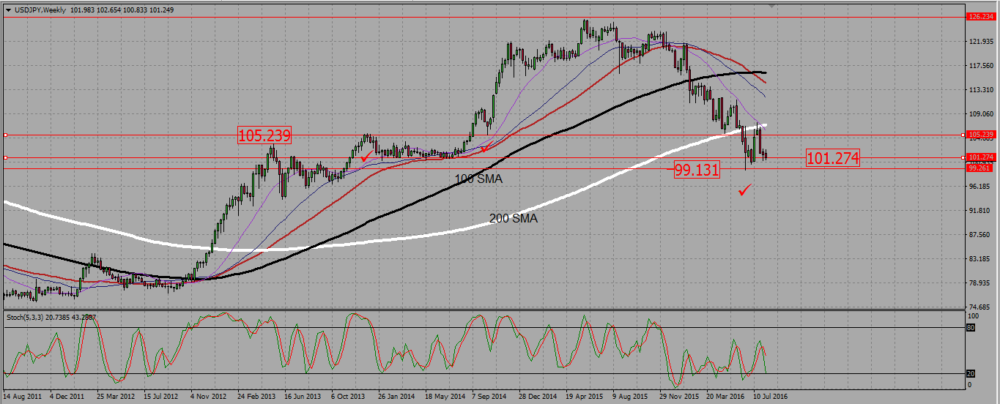
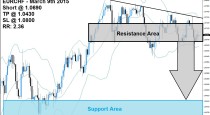
Take note on the weekly chart, that after reaching the last low around 99, the pair pulled back up and made another surged down, but then, instead of breaking down the last low, it rejected a support near 100 level, and bounced back up from it.This means we may be entering a higher lows kind of situation. The pair is now going down again, to retest the 100 support.
USDJPY WEEKLY CHART.
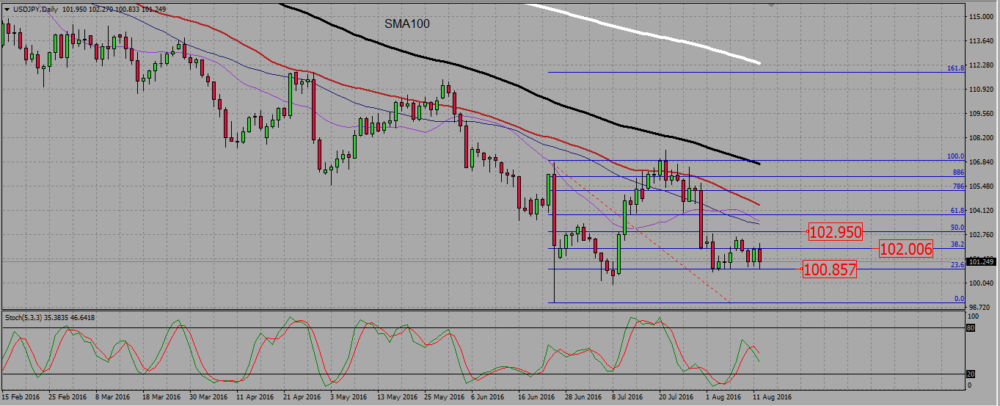
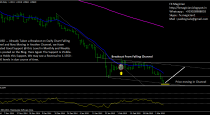
The daily chart is a downtrend, and would be a screaming sell if that pair was not standing on a monthly support zone. If we draw the Fibonacci retracement of June 26th (the day of the british referendum), we see the pair being unable to break down the 23,6 level around 100,8. As last Friday candle is bearish, it may be UJ will eventually break that level down, to go and retest the lows near 100 and 99.
USDJYP DAILY CHART.

 (1 votes, average: 3.00 out of 5)
Add your review