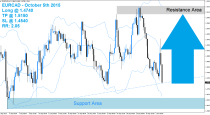
EURUSD trading plan.
Watch price action near 1,11, and also 1,105 where there is a daily support trend line. Look for buying signals there towards 1,13 -1,14. If the daily support trend line is broken down, sell signals towards 1,09.
On the monthly chart, the euro has been ranging since March 2015, roughly between 1,09 and 1,14. The pair seems to ends August with a doji, and it trades currently at an inner support/resistance line around 1,11. We will address this more in detail on the daily chart. The SMAs indicate a bearish configuration, I will rather trade reversals on supports/resistances until I see a clear proof the euro is ready to break that monthly range.
EURUSD MONTHLY CHART.
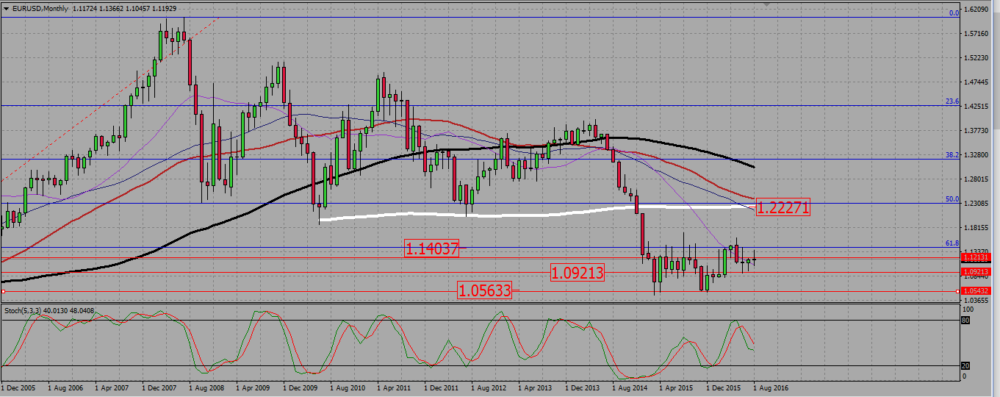
Last week I wrote that the euro would probably not break the 100 SMA resistance near 1,14. This week candle completes dark cloud cover pattern; the pair rejected that resistance, but technically this is not yet a valid bearish signal.
Although the long term SMAs -100 and 200- suggest a bearish trend, shorter terms SMAs are mixed, and the pair is obviously ranging. I will avoid trading breakdown or breakup setups here, to concentrate rather on reversals.
EURUSD WEEKLY CHART.

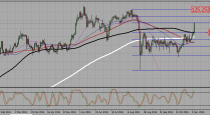
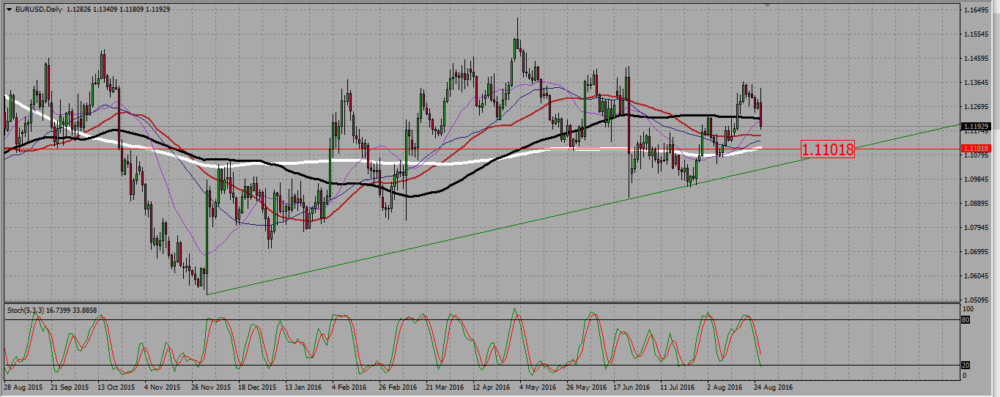
On the daily chart, there is no trend: the SMAs are flat and mixed. We may here have a closer look at that 1,11 level we noticed on the monthly chart. It has been broken several times, therefore is not that strong, and I will certainly not trade a break down of that level, even if Friday candle suggests the pair is now going down. Depending upon the signal quality, I may consider selling a confirmed break down of the support trend line we see on that chart, towards the monthly range support at 1,09. But I would obviously prefer to buy reversals near 1,11 1,105.
EURUSD DAILY CHART.
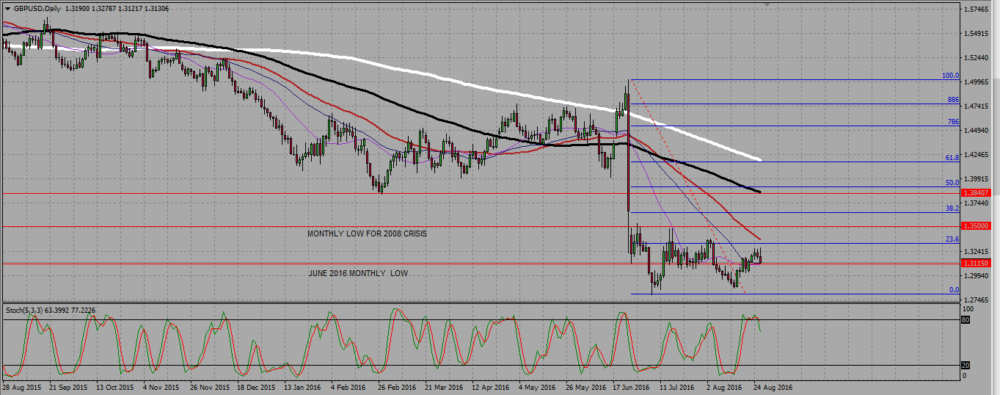
GBPUSD trading plan.
Watch the retest of last June low around 1,31, and trade signals in both directions : towards 1,322 and 1,35 for longs, and as a swing trade -no take profit level- for short, but then mind the 1,30 level.
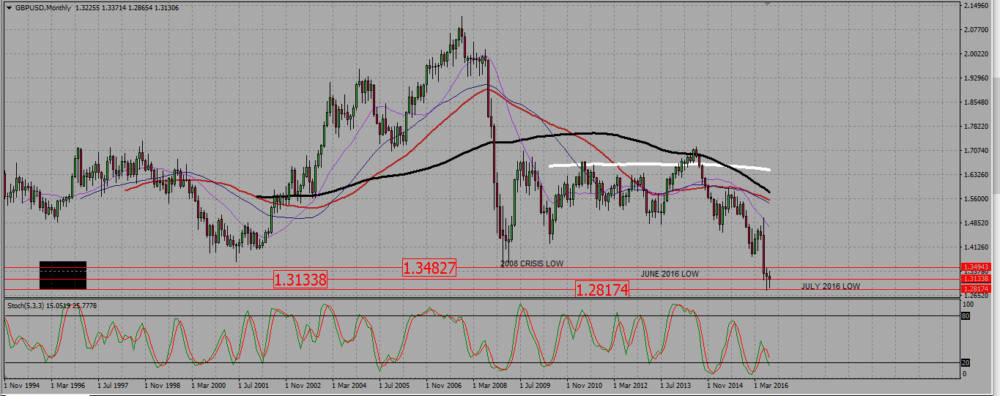
On the monthly chart, there was a hammer in July, and it seems we will have another one in August. As price action is the purest of all indicators, we must acknowledge the fact this pair is willing to reverse north. In that case, the 2008 low around 1,345 -1,35 will be our take profit level.
GBPUSD MONTHLY CHART.
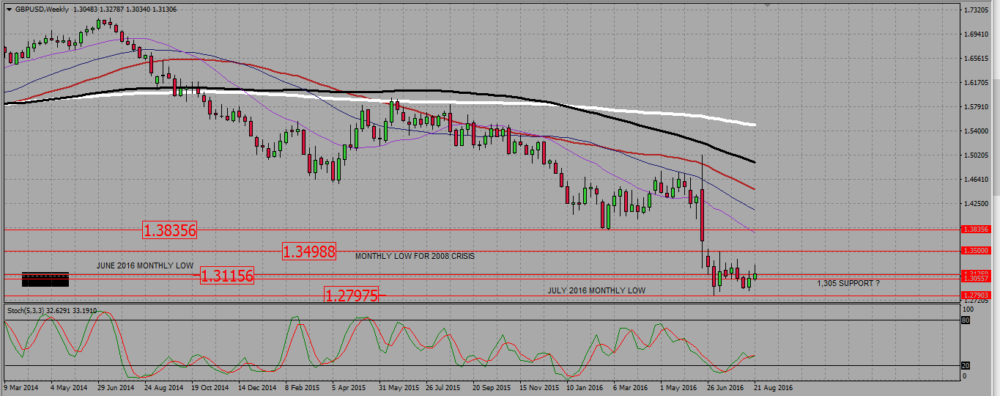
The weekly chart looks very bearish but the pair seems is running out of steam on its way down. After making a historical low around 1,28, it is now slowly ranging up. Last week candle was a ‘kind of’ bullish engulfing candle, and this week shows some follow-up, but the candle has a long up wick; it does not loook ready to go up yet.
GBPUSD WEEKLY CHART.
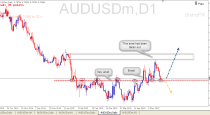
The daily chart shows a situation we saw hundreds of time : the pair broke June low resistance near 1,31, ans is now retesting it as a support. All we have to do in monitor the price action there. After what we see on the monthly chart, I would prefer to buy the cable there, but I will also sell a confirmed break down of that level. In that case I will try to keep it as long as possible, paying attention to what happens near 1,30, a psychological level.
GBPUSD DAILY CHART.
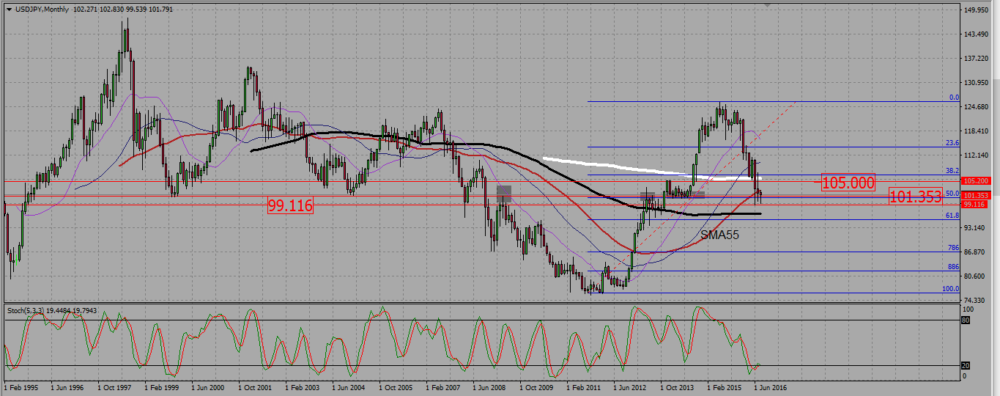
USDJPY trading plan.
The pair seems finally to reject a strong monthly support near 100. Buy signals near 101, or confirmed break up near 102. I will not sell the yen this week, unless there is a crystal clear signal.
On the monthly chart we see a hammer. It is not very beautiful, but it happens on a very strong monthly support near 101, with a 50 Fibonacci support level, and at a strong support/resistance zone -see gray areas-. You want to buy this pair.
USDJPY MONTHLY CHART.
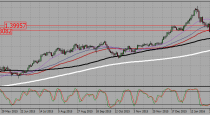
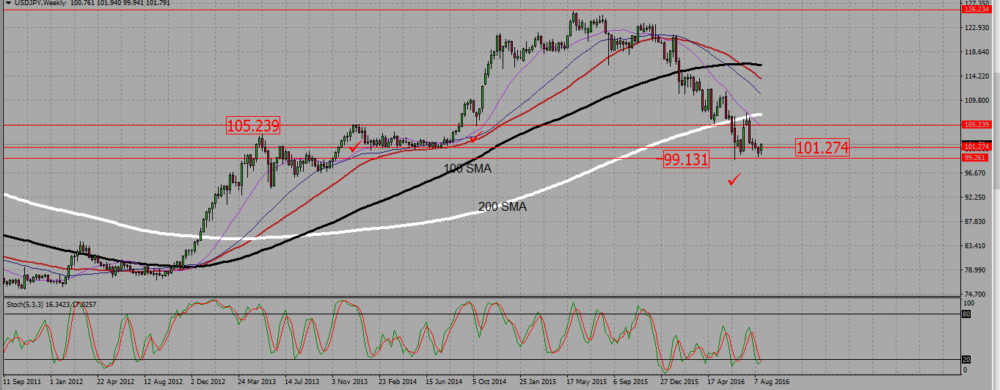
On the weekly chart, long terms SMA indicate an uptrend. The pair double bottomed around 99, and this week candle is a clean bullish one, that broke a resistance near 101,25. I would love to see a retest and a buying signal there.
USDJPY WEEKLY CHART.
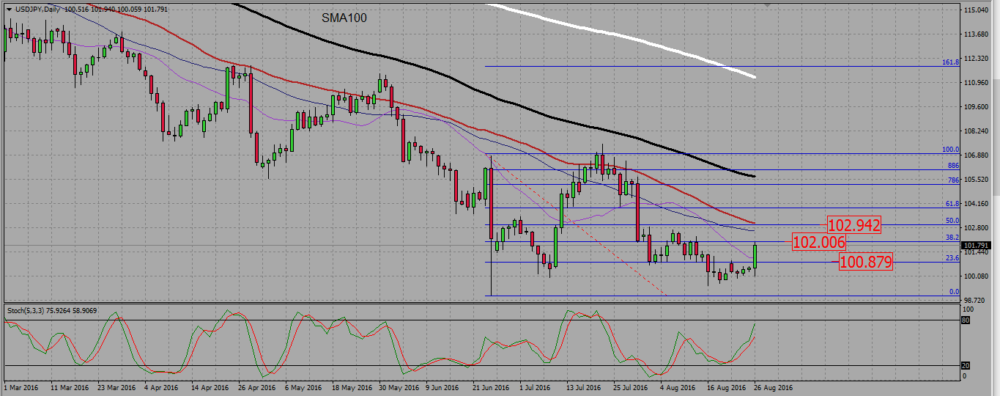
Finally the daily chart. It is a clear downtrend, but for the reasons I explained earlier, I prefer to buy the USDJPY. Friday candle, a strong bullish one, also suggests that pair is now ready to rise. I will buy a retest in the 101,25- 100,75 area, and I will also buy a confirmed break up of the Fib resistance level we see at 102. no selling this week, unless I see a absolute clear signal.
USDJPY DAILY CHART.
 (No Ratings Yet)