
GBPUSD trading plan
The cable shows an indecision; it is at a strong support area from which it should bounce, but rumors of a possible Brexit obviously pull it down. Trade the breaking -up or down- of a consolidation wedge on H4.
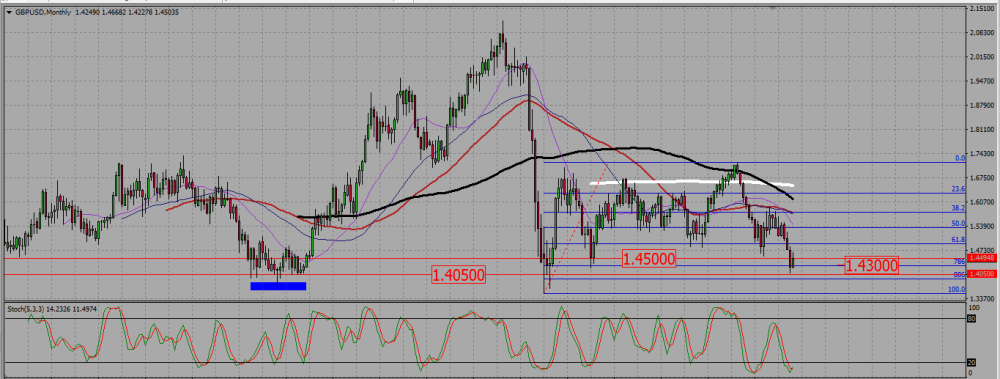
On the monthly chart, we see the current candle being bullish, but with an up wick meaning the pair cannot pass a resistance located around 1,45. The SMAs are rather pointing down, but the whole area from 1,45 to 1,40 seems quite supportive.
GBPUSD MONTHLY CHART.
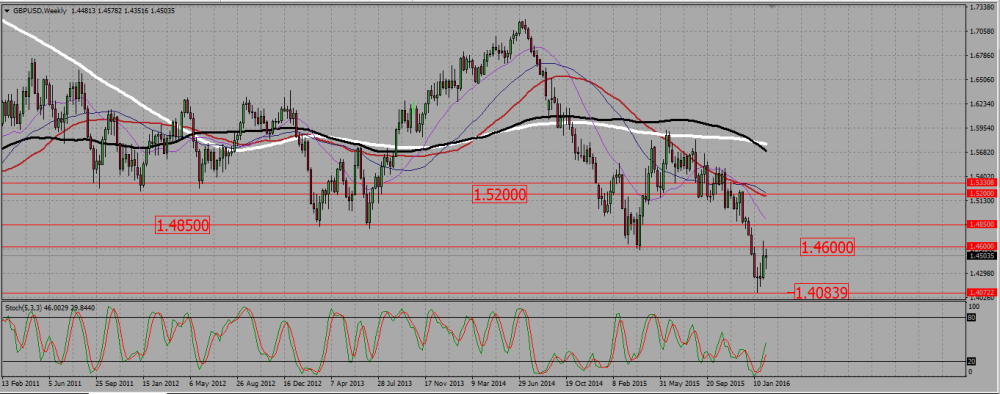
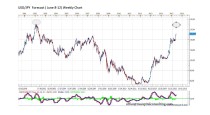
On the weekly chart, the SMAs show a downtrend. The pair rose from the 1,40 area, to be stopped by a strong resistance around 1,46. The current candle is a high wave indecision one, just under that resistance. It is entirely included in the previous candle, reminding somehow of a bearish harami.
GBPUSD WEEKLY CHART.
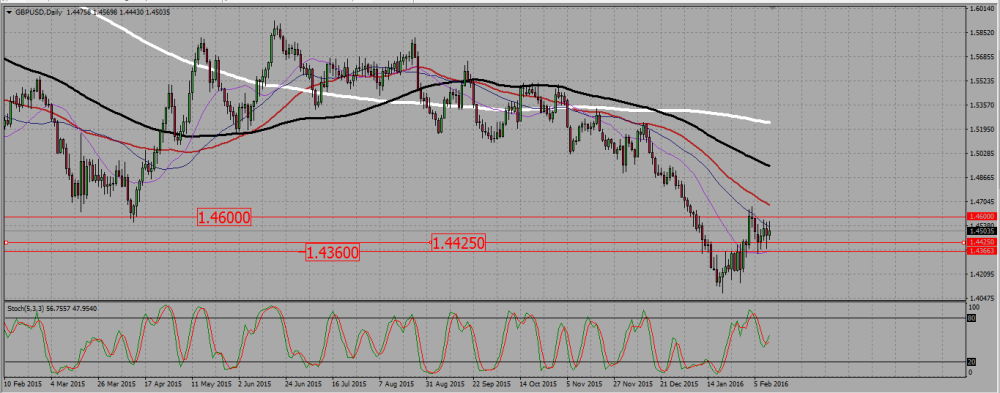
That weekly indecision is reflected on the daily chart, where we cannot see any clear directions. Although the SMAs are pointing down, the pair is rather consolidating up, that consolidation being blocked by the 1,46 resistance line. Will the cable keep on consolidating, or will it resume its bearish longer term trend ? Is is hard to predict from that chart : the 1,46 resistance is strong, but on the other side we have several long down wicks on the candle under 1,4425, meaning that level is a support area.
GBPUSD DAILY CHART.
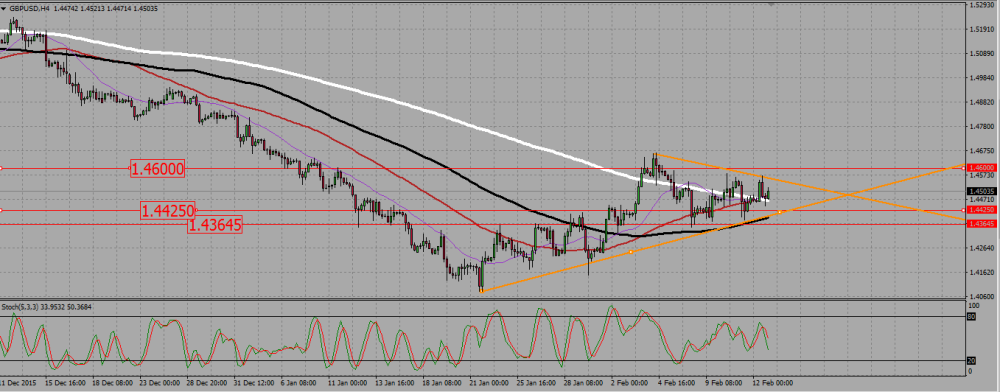
That indecision is seen on the H4 chart, where the pair is consolidating within a wedge. I will cautiously buy or sell a break out from this wedge, keeping altogether an eye on the 1,46 and 1,4425 levels.
GBPUSD H4 CHART.
USDCAD trading plan.
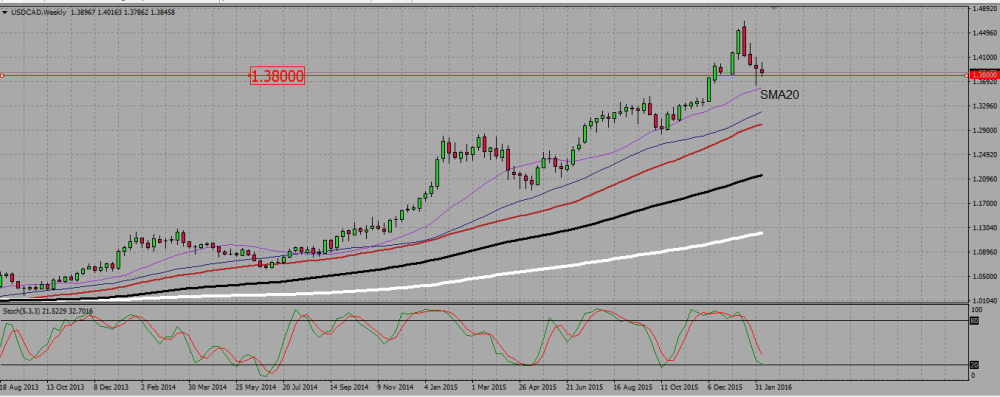
There is a bullish harami on the weekly chart, nearly matching a range zone between 1,40 and 1,38. Favor long trades above 1,3675, to resume the bullish trend.
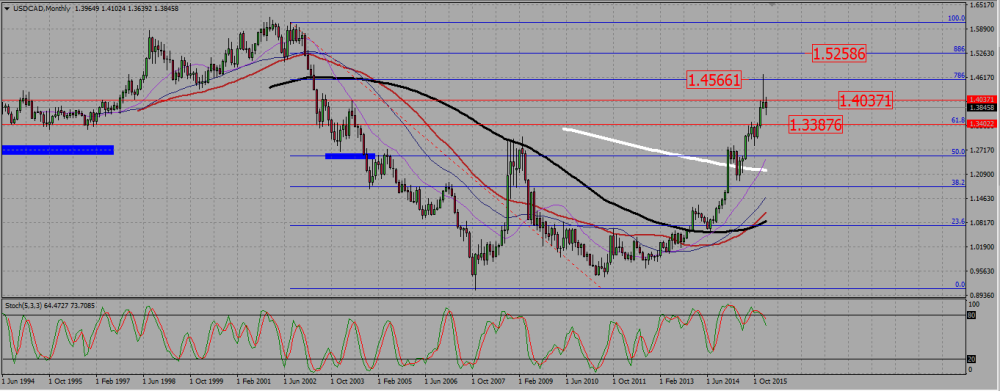
On the monthly chart, and after rejecting a 0,786Fibonacci resistance around 1,456, the pair reversed down, and broke a minor support around 1,40 – 1,403. It is retesting that support as a resistance, and for the moment, the current candle being bearish, seems to fail that retest. In such a case, it will probably go back all the way towards 1,3375 which is the last strong support on the monthly chart.
USDCAD MONTHLY CHART.
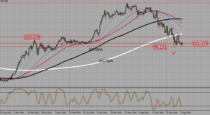
On the weekly chart we see the last four candles being bearish, and that is something that did not happen since May last year, where we may see even five bearish candles, then the bullish trend resumed.
Last week candle is an indecision candle, close to a hammer. Together with this week candle it forms a bullish harami, near a support line around 1,38.
USDCAD WEEKLY CHART.
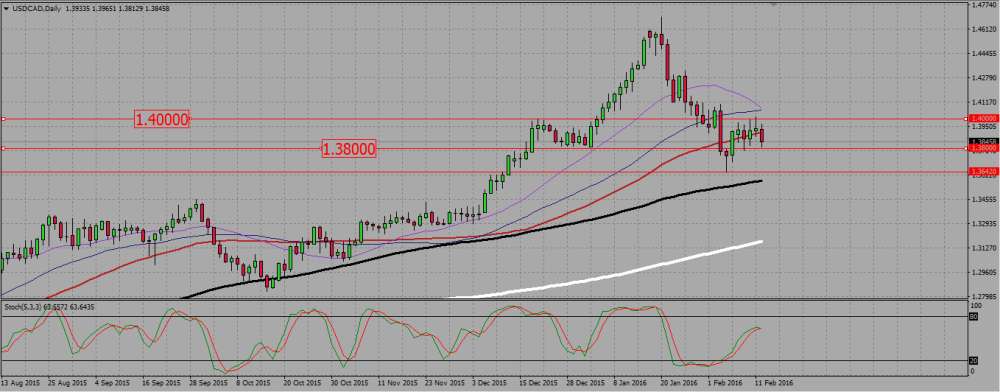
On the daily chart, we see that after going as low as 1,364, the loonie jumped back into a range between 1,40 and 1,38. It is now retesting the support of that range.
USDCAD DAILY CHART.
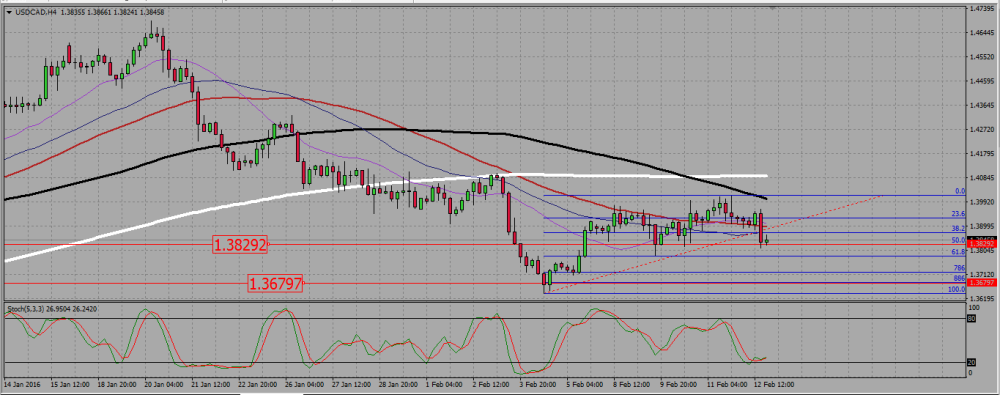
If we look at the H4 chart, a Fibonacci retracement of the last bullish move shows us two important levels: the first is around 1,38, where the 50 retracement level is located. We ended the week with that level being retested as a support. The second would be the 0,886, around 1,3675, which will stand as my last line in the sand to keep a bullish bias, Under it I will rather look to go back to the monthly support around 1,3375.
USDCAD H4 CHART.
 (1 votes, average: 5.00 out of 5)
Add your review