
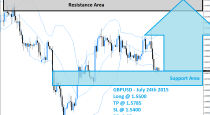
Under 1,44, sell rallies towards 1,4050, minding a weekly flag support around 1,42. Buy signals above 1,45.
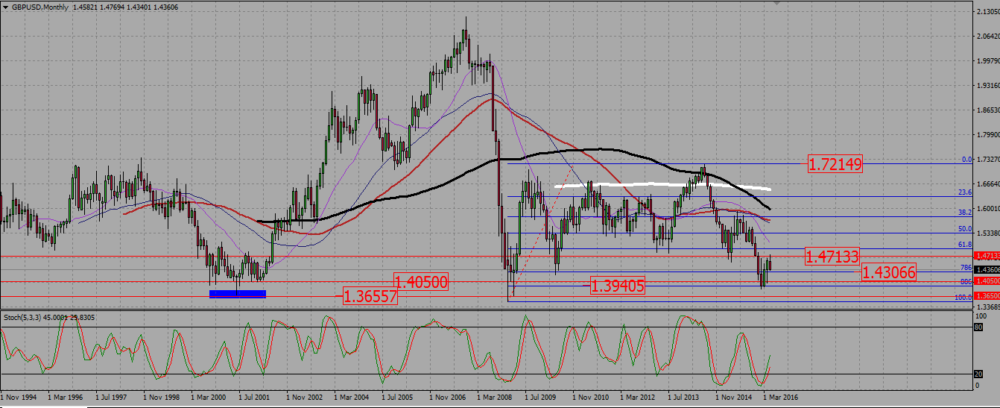
On the monthly chart, and after falling below 1,40, the pair found the strength to rally around 700 pips, but seems now to be rejecting a resistance around 1,475. SMAs suggest a rather bearish trend.
GBPUSD MONTHLY CHART.
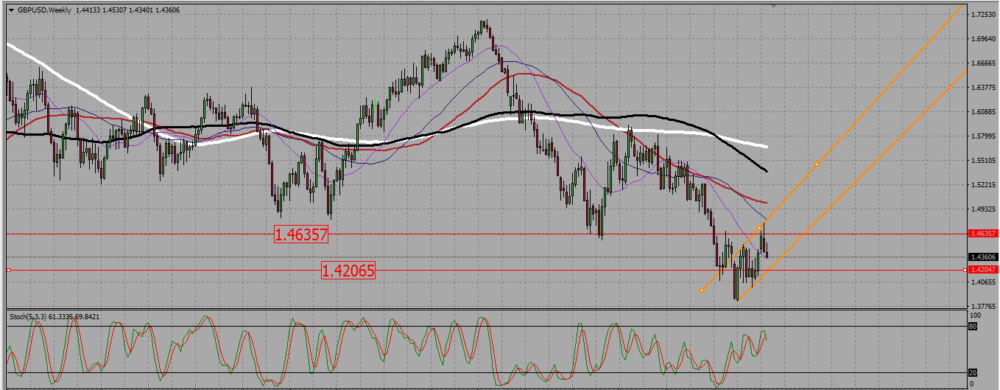
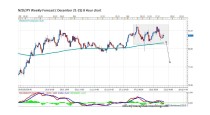
The weekly chart is a clear downtrend, but the cable is also consolidating up in a bullish flag, with a support near a previous low around 1,42. This is definitely a level to watch for a break down towards 1,405, or a reversal towards the flag resistance.
GBPUSD WEEKLY CHART.
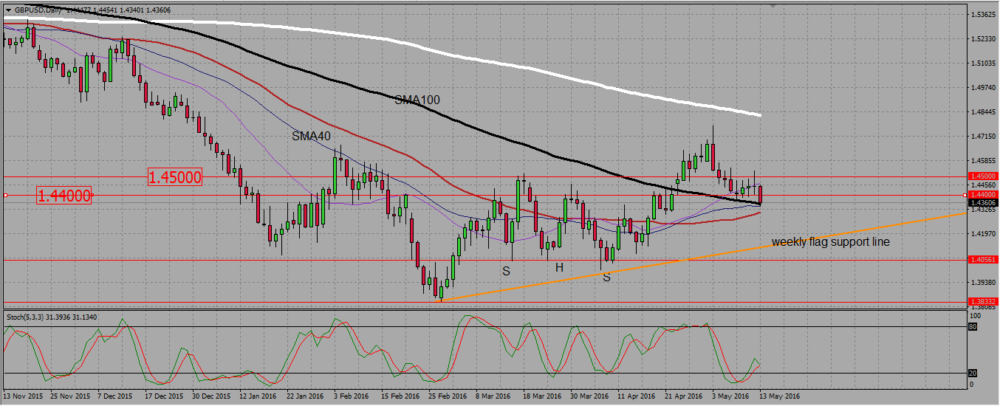
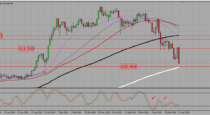
On the daily chart, the bearish trend is not anymore that obvious. If the 200 and 100 SMAs are still pointing down, shorter terms SMAs are rather turning up, reflecting the consolidation within the weekly bullish flag. Nonetheless, the last candles show the cable in a bearish mood. It has even broke down a support around 1,44. However, it stands now right above both the daily 100 and 40 SMAs around 1,435, and also above the weekly flag support around 1,42. There is no point in shorting that pair just above two supports, therefore I prefer to wait for a little pull back, but below 1,44, in order to sell it.
GBPUSD DAILY CHART.
 (1 votes, average: 5.00 out of 5)
Add your review