
USDJPY TRADING PLAN
Watch 105,5 – 105,25 and buy signals there for it is a strong monthly support. Sell break down of 105 towards 101 and lower.
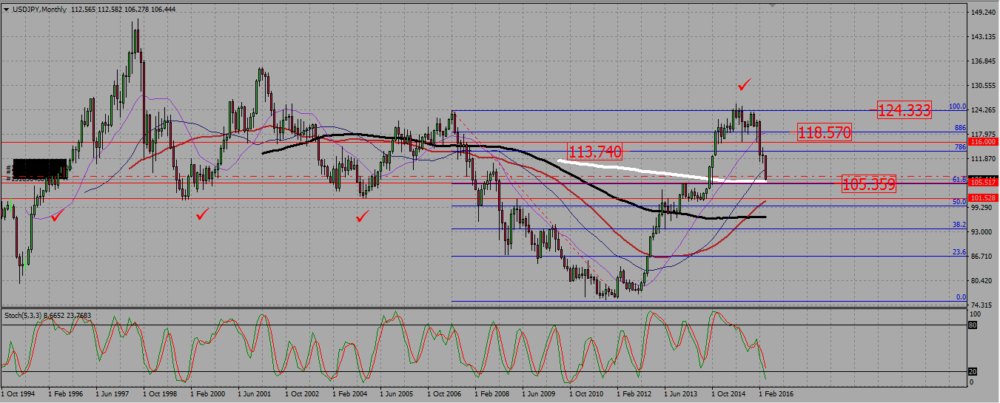
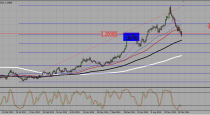
On the monthly chart, USDJPY is in the bearish consolidation of a bullish trend, but the pair is approaching a very strong support zone, with a Fibonacci level, the 200 SMA, and a psychological number (105). I will buy any good signal there, but should the pair broke down 105, then I will sell towards the support around 101, and may be even the 50 Fibonacci support level around 99.
USDJPY MONTHLY CHART.
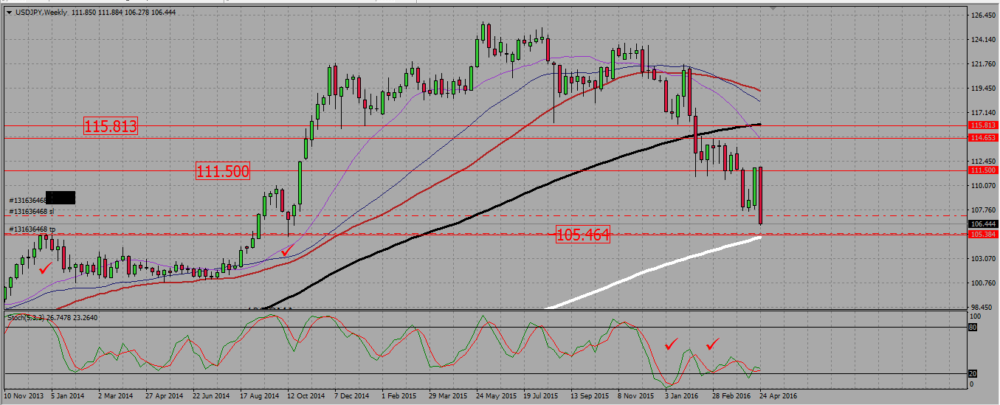
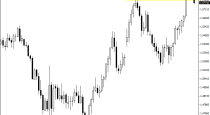
The weekly chart is still an uptrend, with the 200 and 100 SMAs still pointing up, but shorter terms SMA are pointing down. The 200 SMA is reaching the support zone we have identified on the monthly chart, that is around 105, adding to the importance of that support. We may also notice a stochastic bullish divergence. There is no sign that the pair is going to reverse yet, but that would be a very good level to do it.
USDJPY WEEKLY CHART.
 (2 votes, average: 5.00 out of 5)
Add your review